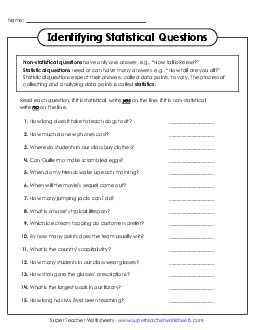
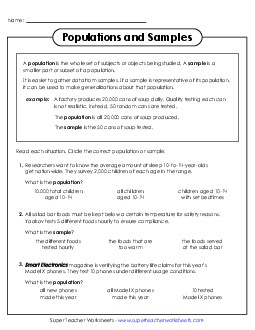
Each question on this worksheet describes a situation and then asks the students choose either the sample or population that is described. The page includes a description and example students can refer to if they need a reminder of the difference between populations and samples.
6th and 7th Grades
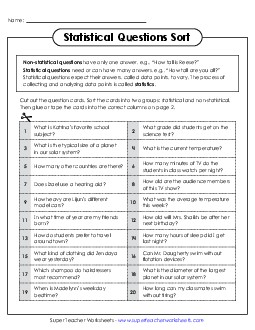
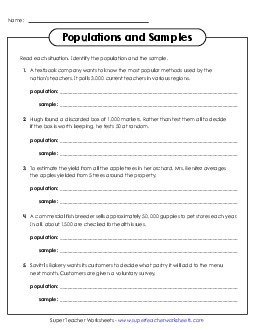
Reinforce students' understanding of population and sample with this worksheet. Students will read about a situation and identify both the population and the sample described.
6th and 7th Grades
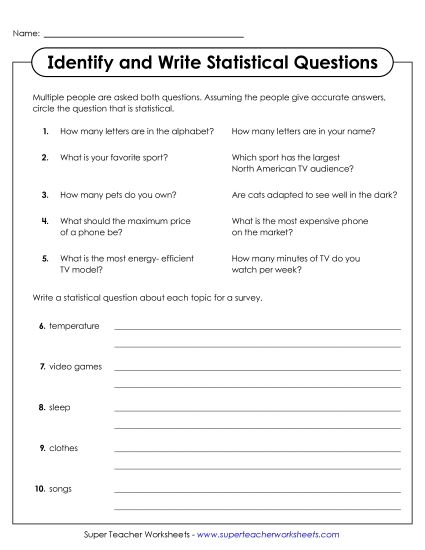
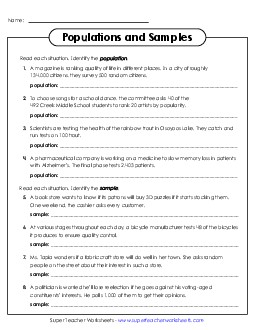
Read each situation and identify the population. This worksheet helps students learn to distinguish between population and sample.
6th and 7th Grades
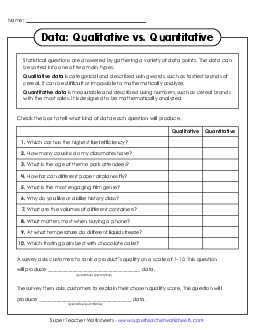
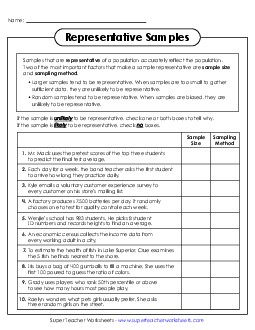
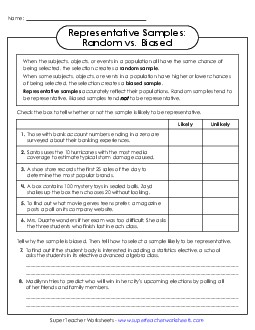
Read examples of samples and decide whether they're likely to be representative or not. If they're not, decide whether the issue is with sample size, sampling method, or both.
6th and 7th Grades
Determine whether samples described are likely to be representative of their populations or not. This worksheet includes a description of random and biased samples.
6th and 7th Grades
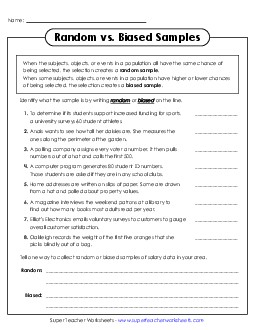
With this worksheet, students will practice identifying whether a sample is random or biased. The top of the worksheet offers a brief explanation students can reference to help them complete the assignment.
6th and 7th Grades
Measures of Center and Variability
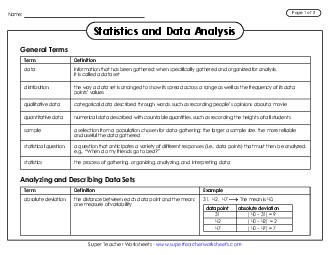
Use this printable statistics reference sheet to help students differentiate between and calculate three measures of variation: range, interquartile range, and mean absolute deviation. Includes models and explanations of each measure's limitations.
6th and 7th Grades
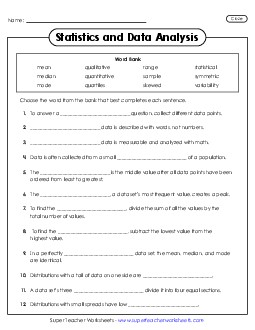
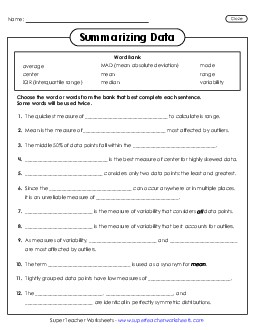
In this statistics cloze activity, students identify when to use median instead of mean (and vice versa), which measures of variation describe which types of data spread, when different measures of center are the same, and other details essential for summarizing data sets.
6th and 7th Grades
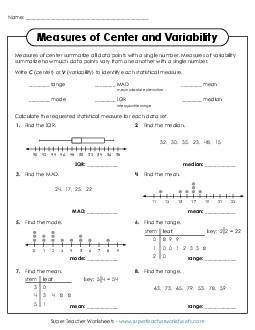
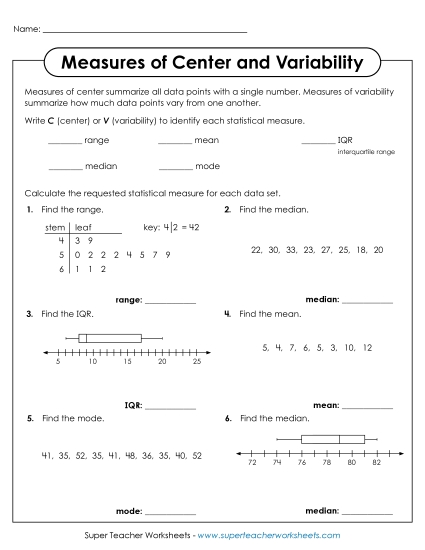
Worksheet includes mean, median, mode, range, interquartile range (IQR), and mean absolute deviation (MAD). First, identify what the statistical measures summarize: center or variation. Then calculate each kind.
6th and 7th Grades
Students using this worksheet will determine whether range, mean, median, mode, and interquartile range (IQR) are measures of center or variability. Then they will find one of these measures for each of the given data sets.
6th and 7th Grades
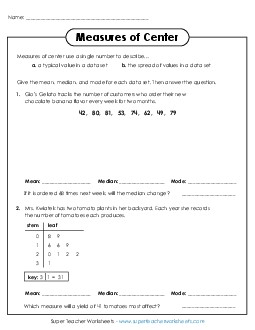
This 2-page worksheet presents four scenarios using plain data sets, stem-and-leaf plots, or dot plots. Find each measure -- mean, median, and mode -- then answer a question using the data, such as telling the impact of changing or adding a data values.
6th and 7th Grades
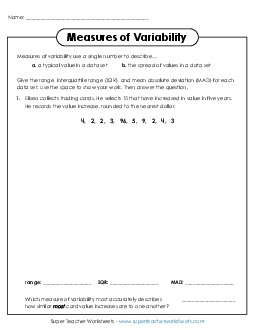
With this worksheet, students will use sets of data to find the range, interquartile range (IQR), and mean absolute deviation (MAD). They will also determine which measures best describe certain data.
6th and 7th Grades
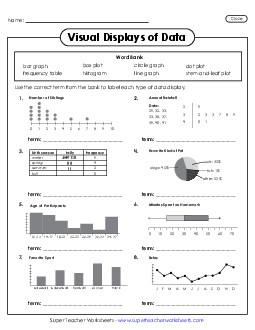
This page links to our data display materials, from pie charts (circle graphs), stem and leaf plot worksheets, histogram activities, and more.
Mean, Median, Mode, and RangeTry our collection of worksheets that focus only on learning the most common measures of center and variability!
Mean (Average) WorksheetsUse these materials as extra practice for learning and mastering calculating averages, from data sets with only 3 values to full word problems.
Measures of Center and Variability WorksheetsFind more in-depth worksheets on measures of center and variability on this page.