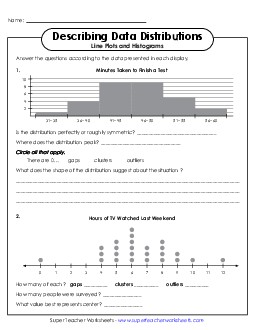
Free Describing Data Distributions (Histograms) Printable Graphing Histograms PDF Worksheet
Describing Data Distributions (Histograms)
Explore the world of histograms with our "Describing Data Distributions" worksheet, perfect for 6th and 7th-grade students. This printable PDF resource offers a fun and engaging way for students to learn about gaps, skews, clusters, and symmetry in data. Ideal for classroom instruction or homework, this worksheet helps to reinforce statistical skills through practice problems, providing clear questions and answers to enhance learning and review.
This worksheet is recommended for students in Sixth Grade and Seventh Grade.
- Common Core Standards
6.SP.26.SP.5a6.SP.5c
 (Printable PDF Worksheet)")
You May Also Be Interested In