What's New on STW
We add new printable worksheets, games, and teaching tools all the time! This page highlights some of our most recent additions to the site.
1,727 new files added over the past 365 days.
(added February 19, 2026)
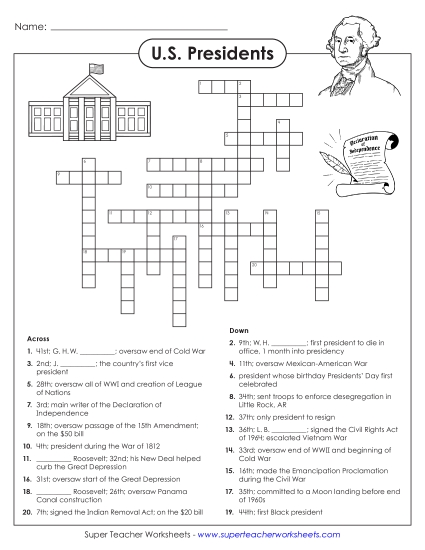
Use names of U.S. presidents to complete this engaging crossword puzzle. Clues include fill-in-the-blank sentences, hints about key parts of their presidencies, and the number president they were.
Filing Cabinet
Logged in members can use the Super Teacher Worksheets filing cabinet to save their favorite worksheets.
Quickly access your most used files AND your custom generated worksheets!
Please login to your account or become a member and join our community today to utilize this helpful feature.
(added February 19, 2026)
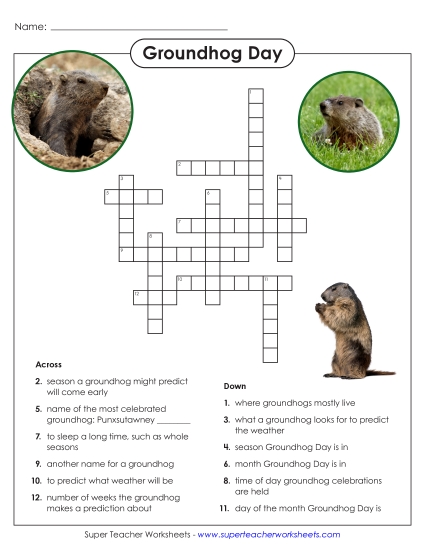
This fun Groundhog Day activity features an optional word bank and informative clues for groundhog-related terms. Words include shadow, forecast, woodchuck, hibernate, spring, and more!
(added February 19, 2026)
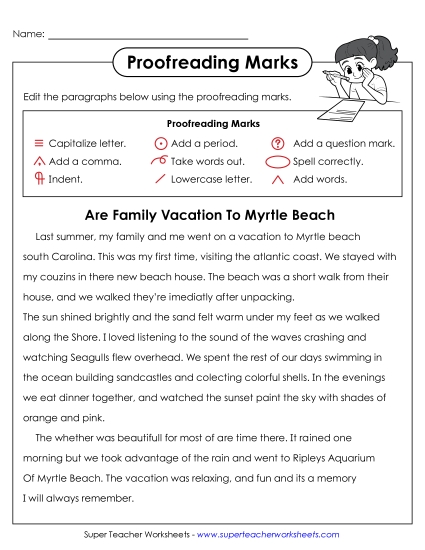
Proofread this passage for mistakes in capitalization, punctuation, formatting, spelling, and more. This passage is intended for students in 5th through 8th grade, working on some more advanced proofreading concepts.
(added February 19, 2026)
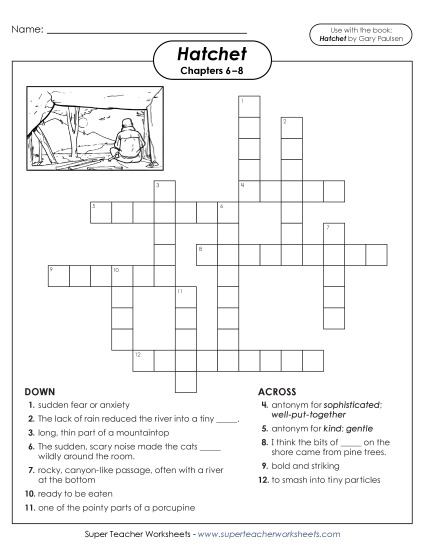
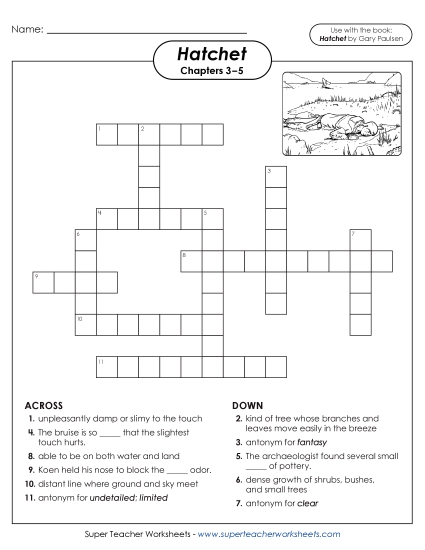
The vocabulary terms for this section of the book include ridge, rivulet, panic, gorge, driftwood, fierce, and more. Use each of them to complete this crossword puzzle. An optional word bank is included on a separate page, if you wish to provide it to students.
(added February 19, 2026)
Use this part of the book's vocab words to fill in the spaces on this crossword puzzle. Clues are given for each of the words, and an optional word bank is included.
(added February 19, 2026)
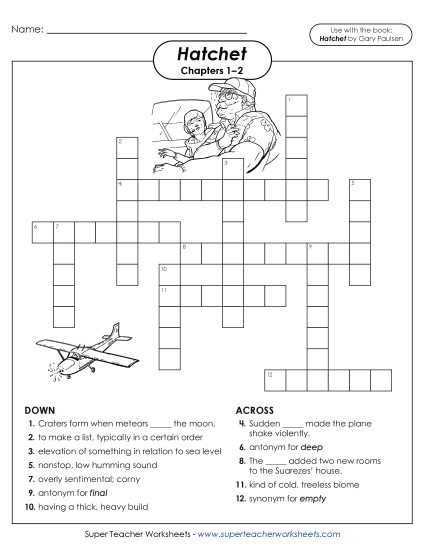
Use the vocabulary words from the first two chapters of the book to complete this fun crossword puzzle activity. Words include shallow, extension, tundra, turbulence, and more.
(added February 19, 2026)
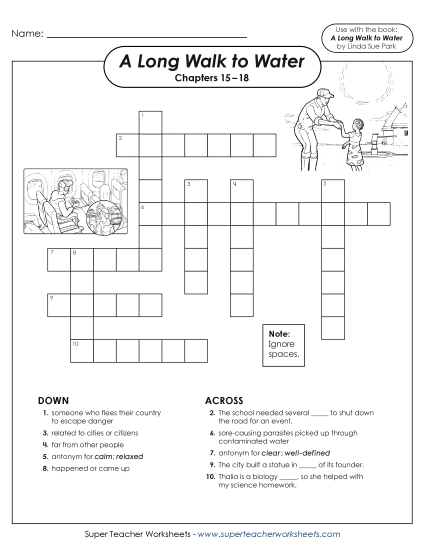
Use the vocabulary words from this part of the book A Long Walk to Water to complete the crossword. Clues include definitions and example sentences with the word missing.
(added February 18, 2026)
Print out this biography of Maria Tallchief, a groundbreaking ballerina from the Osage Nation, and have your students answer the questions that follow.
(added February 17, 2026)
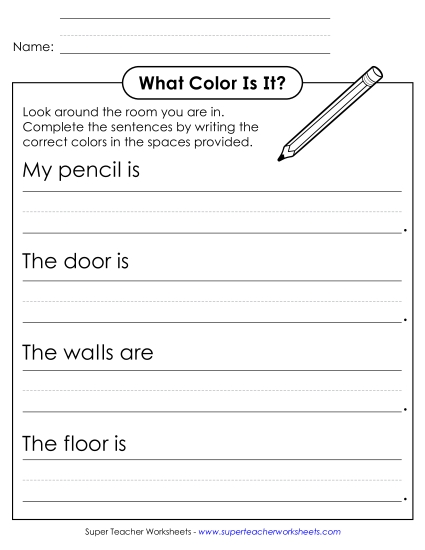
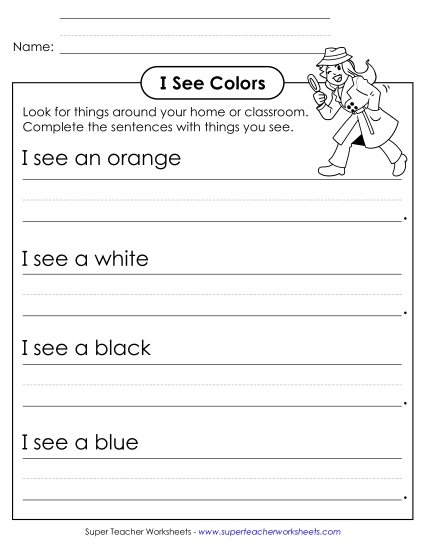
With this worksheet, students will look around and identify the colors of different objects they see. They'll complete sentences with the color of their pencil, door, walls, and floor. They'll also write the color of their favorite shoes, jacket, shirt, and overall favorite color.
(added February 17, 2026)
With this printout, students will look for items of all different colors and write them on the lines to complete the sentences.

Have you seen the Super Teacher Blog? We post fun, new teaching ideas every month.
Be sure to check it out. Go To STW's Blog
(added February 16, 2026)
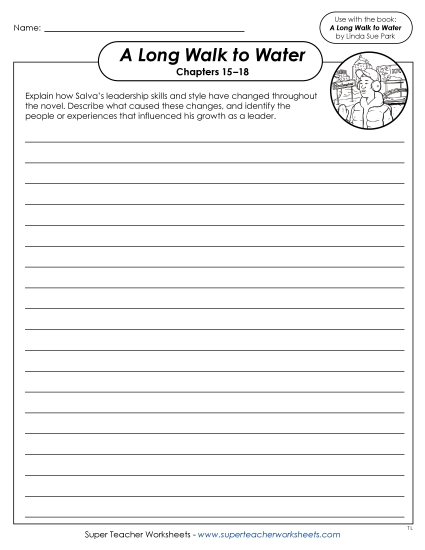
With this writing prompt, students will explore how Salva's leadership skills and style have changed throughout the novel, along with the experiences and people who may have influenced these changes.
(added February 16, 2026)
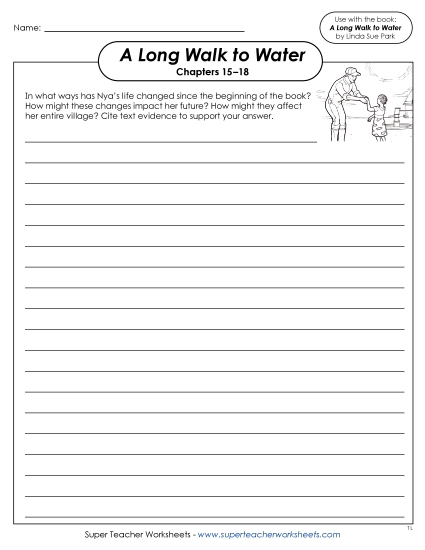
This writing prompt encourages students to think critically about how Nya's life has changed throughout the book and how these changes may impact her future and the other people in her village.
(added February 16, 2026)
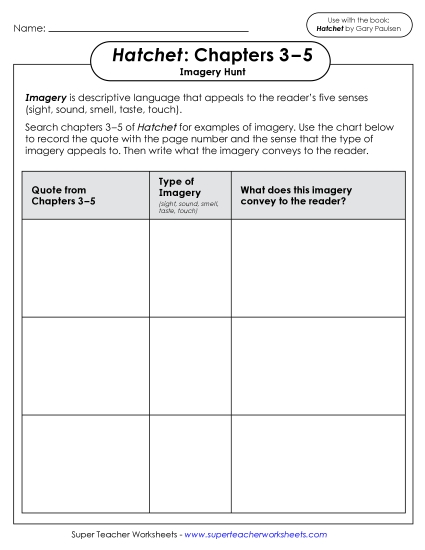
Chapters 3 through 5 of Hatchet feature a great deal of imagery. Teach students what it means and have them look for and record examples of it throughout this part of the book.
(added February 12, 2026)
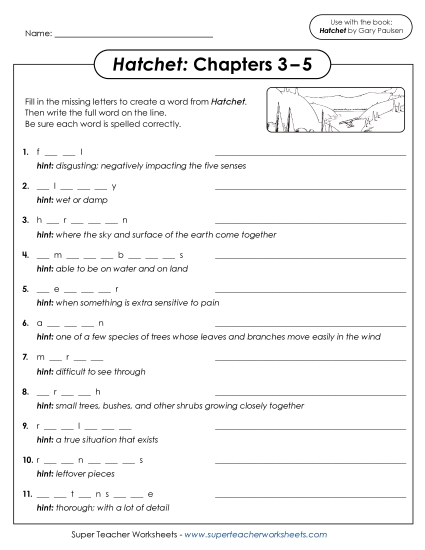
In this vocabulary activity, students will use the hint and given letters to figure out what the word is supposed to be. They will fill in the missing letters and write the complete word on the line.
(added February 12, 2026)
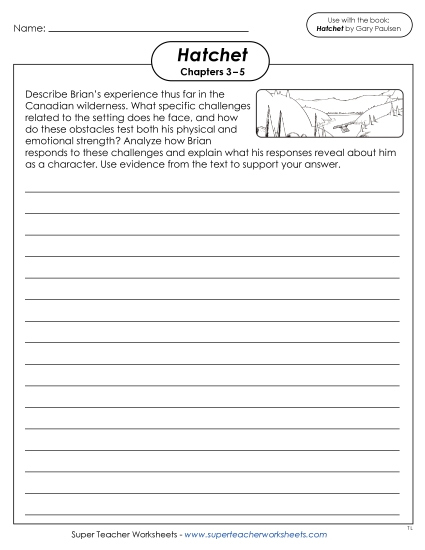
Students are prompted to write about the specific challenges Brian faces in regard to the setting he is in and how he responds to these challenges.
(added February 12, 2026)
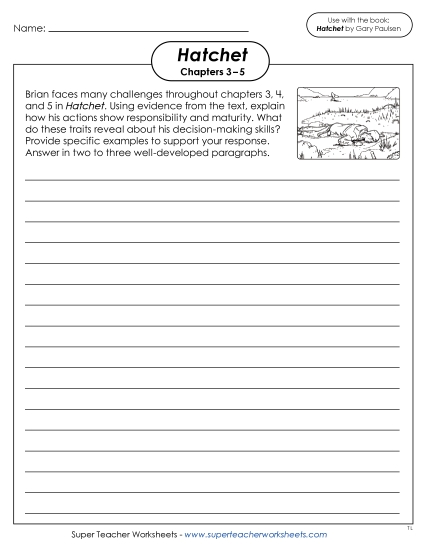
This writing prompt for chapters 3 through 5 of Hatchet asks students to reflect on Brian's actions in regard to how they show responsibility and maturity, as well as what they reveal about his decision-making skills. Students will need to use specific examples and evidence from the text in their responses.
(added February 12, 2026)
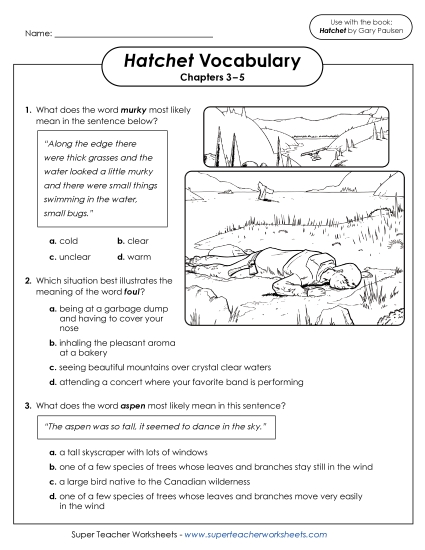
Use this printable vocabulary worksheet to help your students review the vocabulary words from the chapters. Several questions include direct quotes from the text.
(added February 12, 2026)
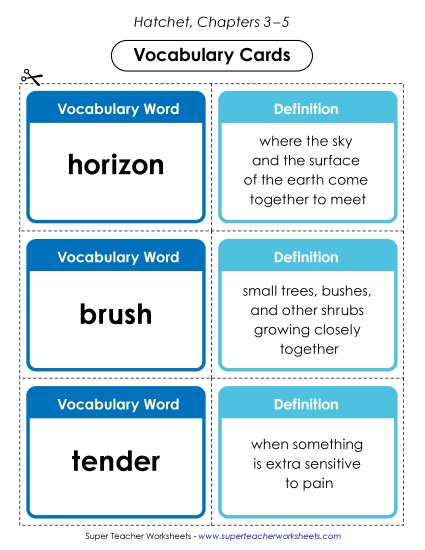
The vocabulary words for this part of the book Hatchet are: horizon, brush, tender, clammy, remnants, reality, aspen, foul, murky, extensive, and amphibious. Use these cards to review the words and their meanings with your class.
(added February 12, 2026)
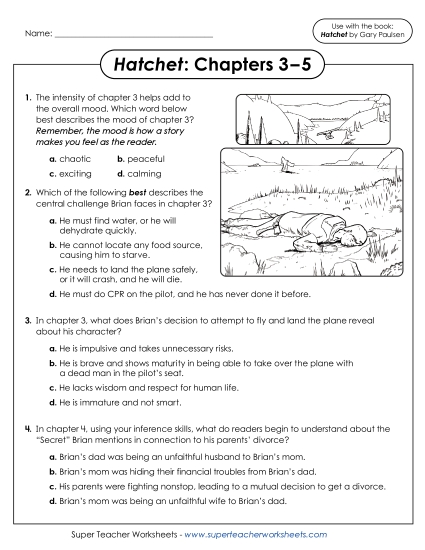
Review chapters 3 through 5 with your students with this set of questions. A mix of multiple choice and short answer questions will test your students' understanding and recall of the events that happened in this part of the novel.
(added February 10, 2026)
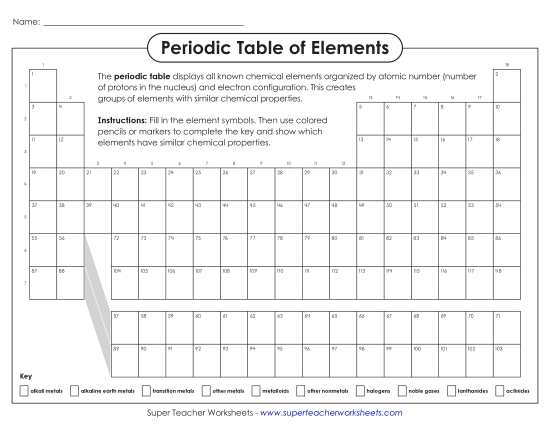
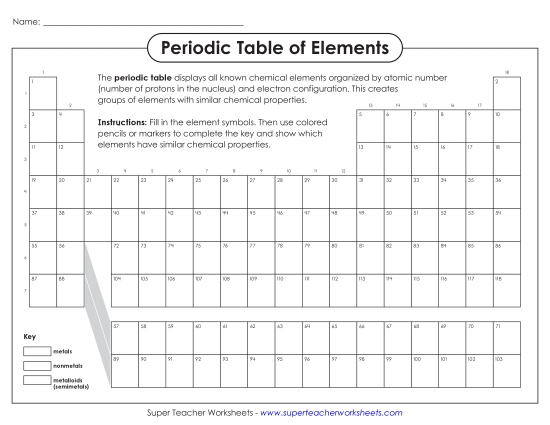
With this fill-in worksheet, students will fill in all element symbols and color to show which elements have similar chemical properties.
(added February 10, 2026)
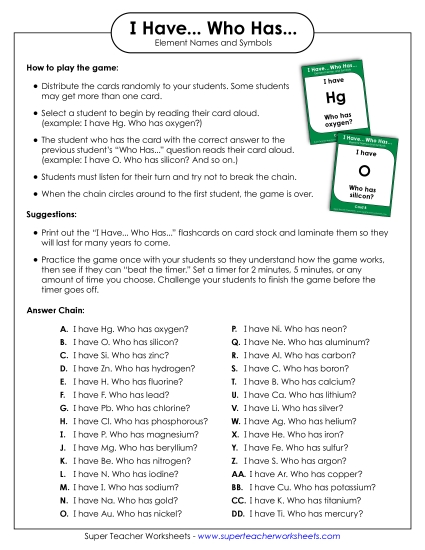
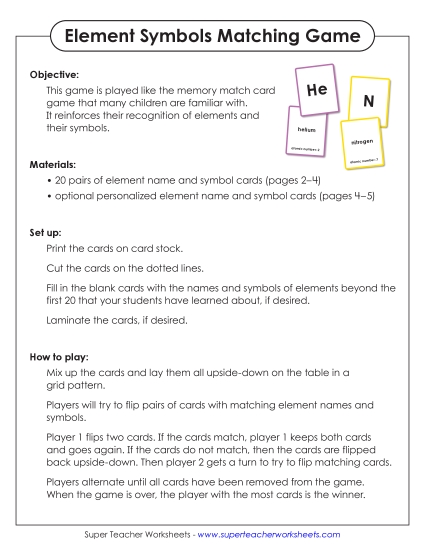
Help your students practice matching element names to their symbols with this engaging group game.
(added February 10, 2026)
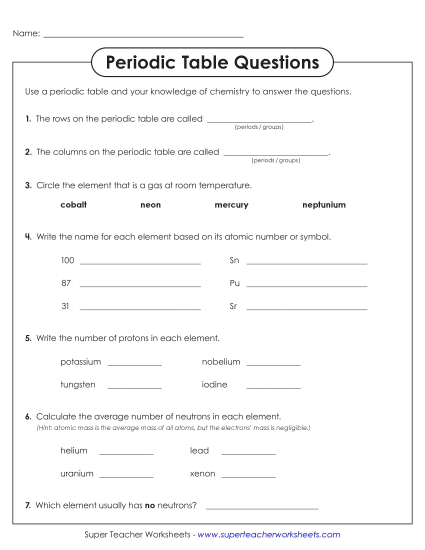
Students will use a copy of the periodic table and their knowledge of chemistry to further explore the elements. They will have to write the names of elements based on their atomic numbers or symbols, find the number of protons in elements, and calculate the average number of neutrons in elements.
¿Habla español?
Many of our worksheets have been translated into Spanish! Click the button below worksheet descriptions to view our Spanish translations. Learn more.
Many of our worksheets have been translated into Spanish! Click the
 button below worksheet descriptions to view our Spanish translations. Learn more.
(added February 10, 2026)
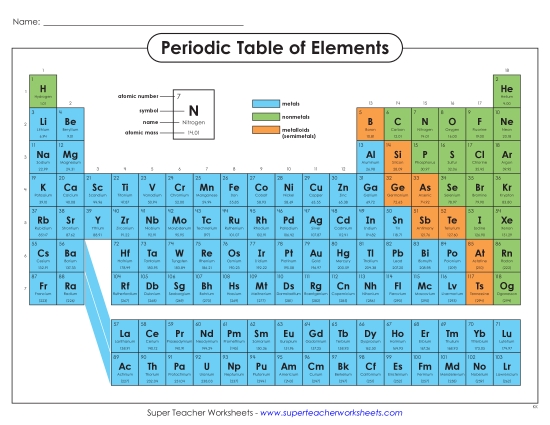
This printout of the periodic table shows elements categorized as nonmetals, metals, and metalloids.
(added February 10, 2026)
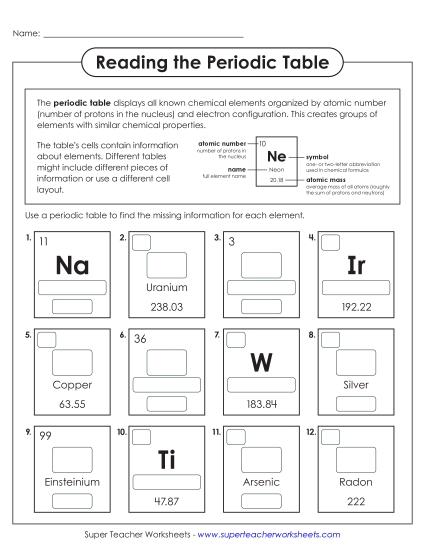
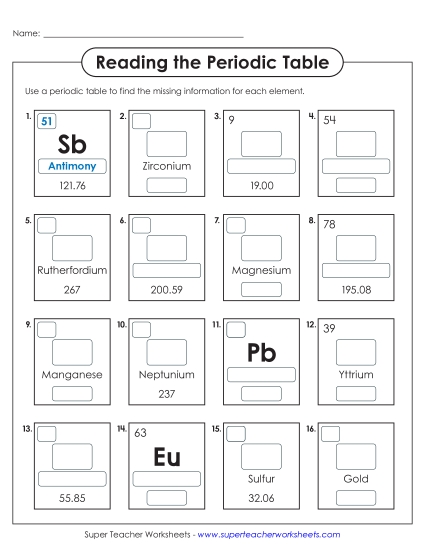
Refer to a copy of the periodic table (such as the one at the top of the page) to complete the missing information about each element. The top of this worksheet includes a brief overview of the information found in a periodic table of elements.
(added February 10, 2026)
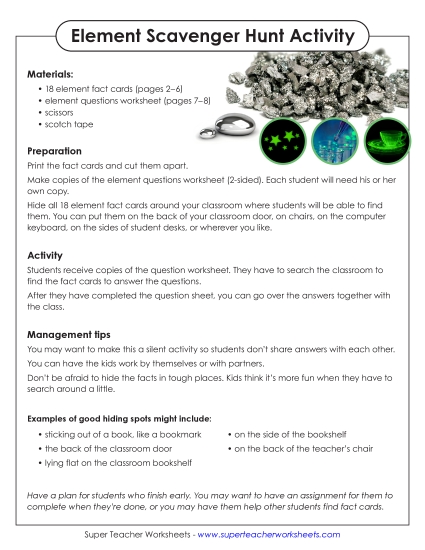
Cut out these fact cards and hide them around the room to have your students complete an interactive scavenger hunt that will teach them fun and interesting facts about elements and the periodic table.
(added February 5, 2026)
Have your students fill in the element symbols and color the key and table to accurately recreate the Periodic Table of Elements. Let them use the printout above as a guide if needed!
(added February 5, 2026)
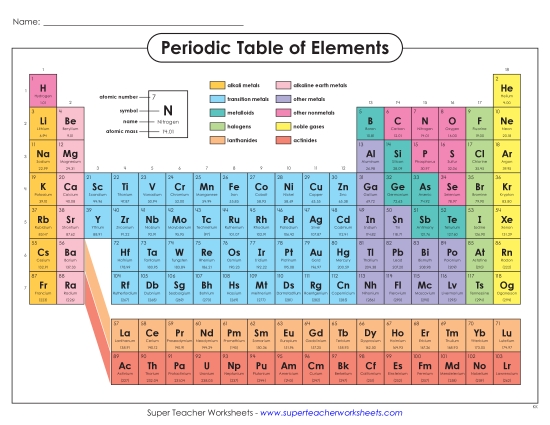
This full-color printout shows the periodic table categorized by element properties. Information given includes atomic numbers, symbols, names, and masses. Print it out for your students to reference while completing many of the other worksheets on this page.
(added February 5, 2026)
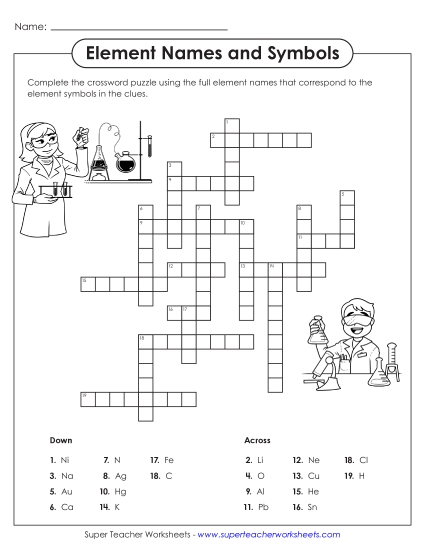
Element symbols are given as clues for this crossword puzzle. Write the full element name in the correct spaces to complete the puzzle.
(added February 5, 2026)
Use a copy of the periodic table to help complete this worksheet. Use the information provided to find the rest of the information for each element.
(added February 5, 2026)
Print off this packet and cut out the cards to play a fun and educational memory game. Players will need to match the cards with the element names and atomic numbers to the cards with the matching chemical symbols.
(added February 5, 2026)
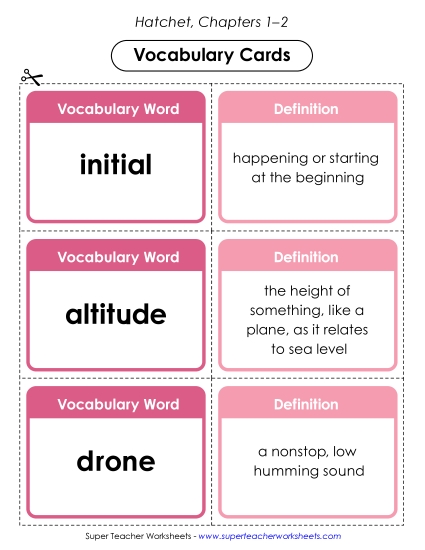
These vocabulary cards can be glued together to make flashcards, cut out separately to use for a memory game, or utilized in any other way that works for you. Terms include: initial, altitude, drone, catalog, extension, tundra, stout, hokey, hollow, turbulence, shallow, and impact.
(added February 5, 2026)
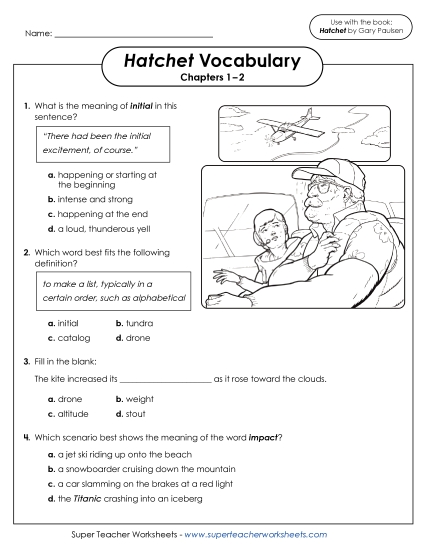
Make sure your students understand the vocabulary words from chapters 1 and 2 of the book by having them answer the questions in this printable packet.
(added February 5, 2026)
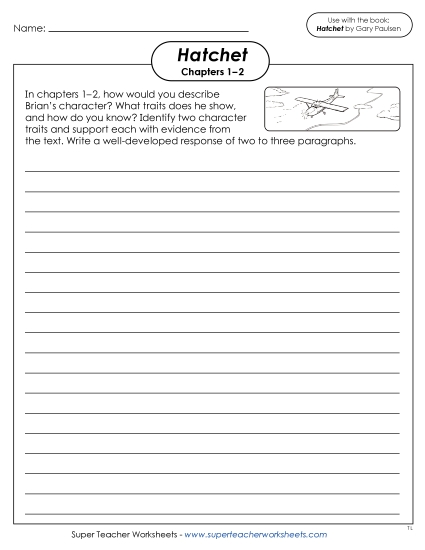
Using this printable, students will be prompted to write about the main character from the book Hatchet. Students must identify at least two character traits Brian has shown and support them with evidence from the text.
(added February 5, 2026)
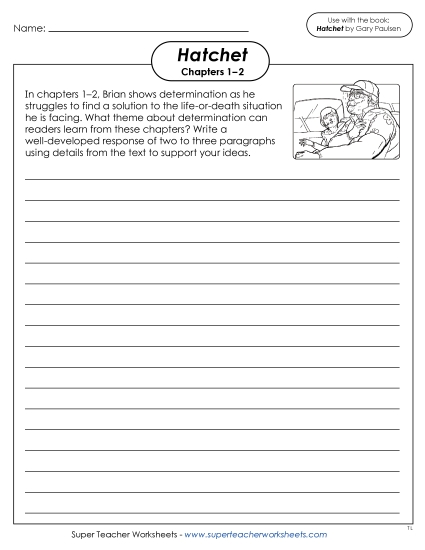
This writing prompt asks students to reflect on Brian's determination, as well as the general theme of determination in this section of the book.
(added February 5, 2026)
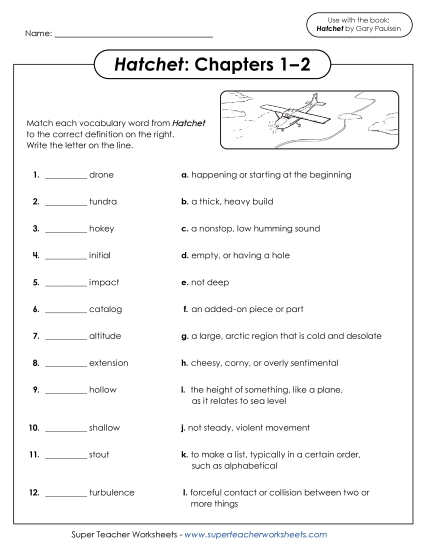
With this activity, students will match vocabulary words from the first two chapters of Hatchet to their correct definitions.
(added February 5, 2026)
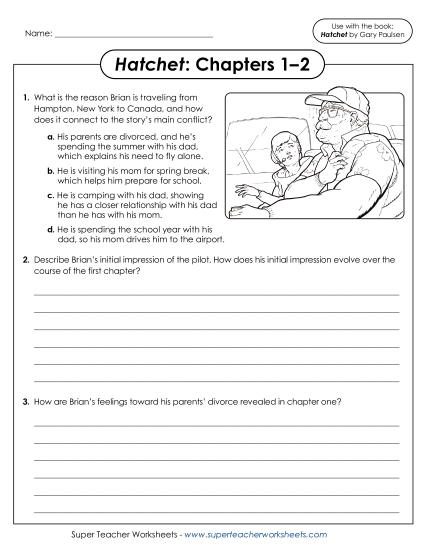
Make sure your students are following along with the text by having them complete this packet at the end of reading the first two chapters of Hatchet. These reading comprehension questions include multiple choice and short response questions.
(added February 5, 2026)
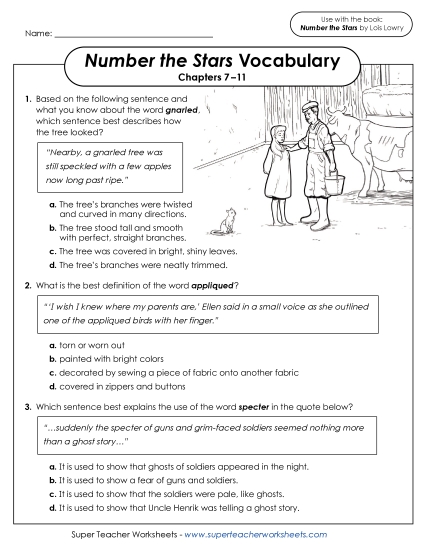
Assign these vocabulary questions to help students practice the terms from this section of Number the Stars. Questions refer to quotes from the text and are multiple choice.
(added February 5, 2026)
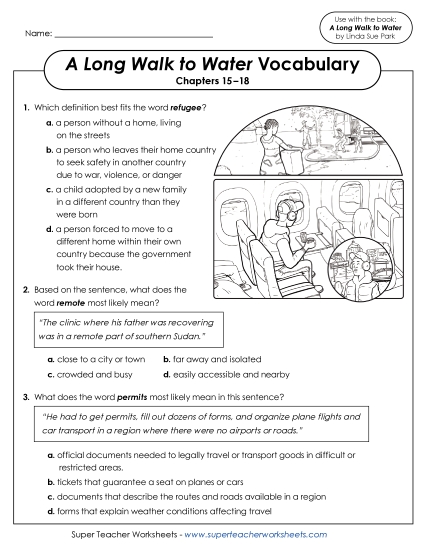
Reinforce a deeper understanding of the vocabulary words from the final section of the book by having students answer the vocabulary questions in this printout.
(added February 5, 2026)
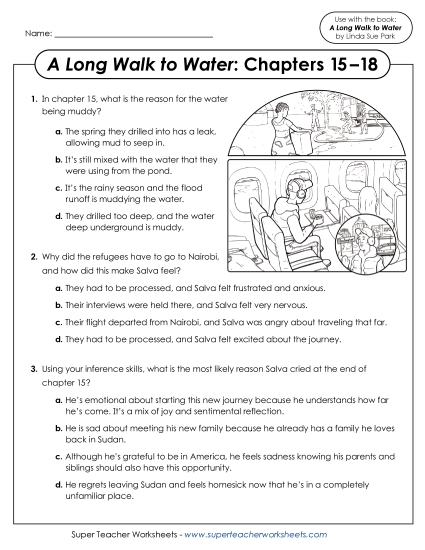
Have your students answer the questions in this packet to demonstrate their comprehension of the events that happened in chapters 15 through 18 of A Long Walk to Water. Both multiple choice and short answer questions are included.
(added February 5, 2026)
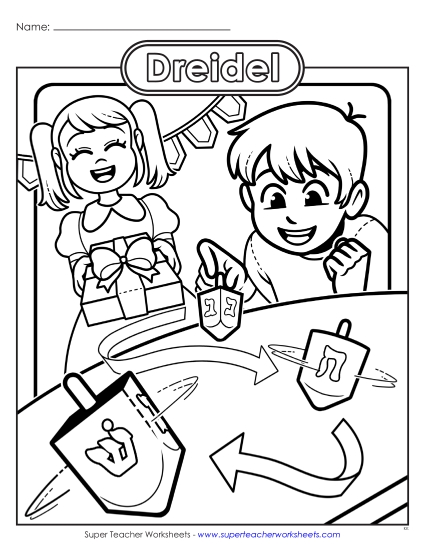
This printable coloring page shows children having fun while playing with a dreidel. It's the perfect coloring activity to give to students learning about Hanukkah and this traditional game.
(added February 5, 2026)
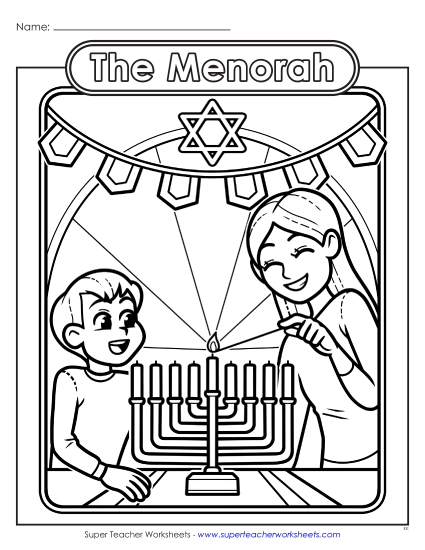
This menorah coloring page is the perfect printout to give students learning about Hanukkah and the symbolism of the menorah.
(added February 5, 2026)
Use this coloring page to supplement your lessons on Hanukkah. It shows two children opening presents in front of a menorah.
(added February 5, 2026)
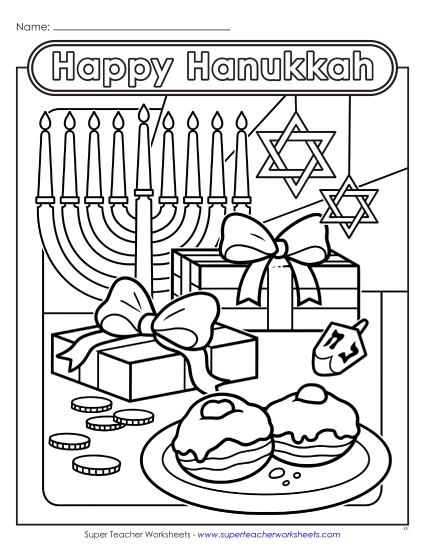
This coloring page features a table set for Hanukkah celebrations. It features a menorah, presents, dreidel, and more.
(added February 5, 2026)
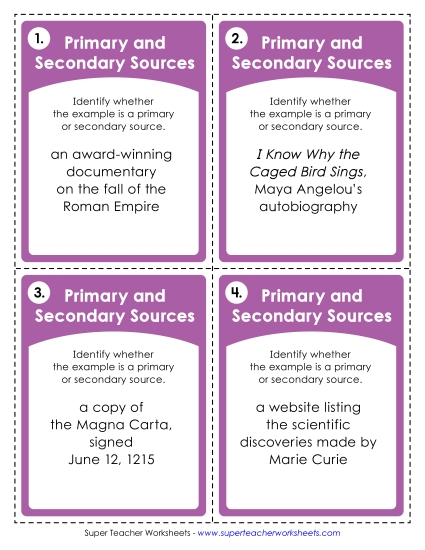
Each of these 30 task cards require students to determine whether a specific source is primary or secondary. Our task cards can be used in centers, as exit slips, or for a variety of games and activities.
(added February 5, 2026)
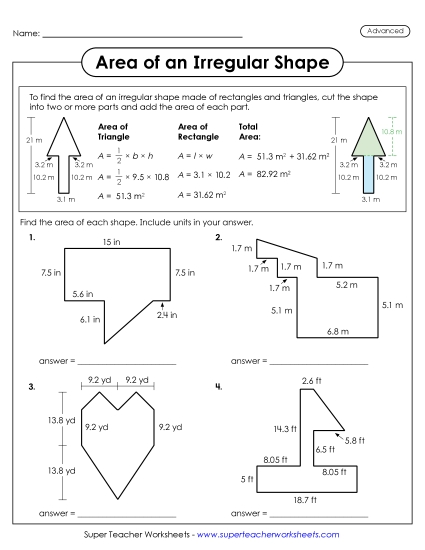
This helpful printable shows how to find the area of a compound shape made up of a triangle and rectangle. Students can use this as a reference when they solve for the area of four more compound shapes.
(added February 5, 2026)
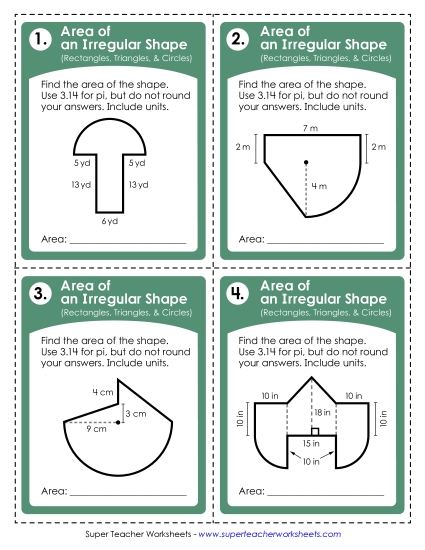
The given lengths on this set of task cards are all whole numbers, making it the perfect set for students just learning the process of finding the area of a composite shape made up of circles, rectangles, and triangles.
(added February 5, 2026)
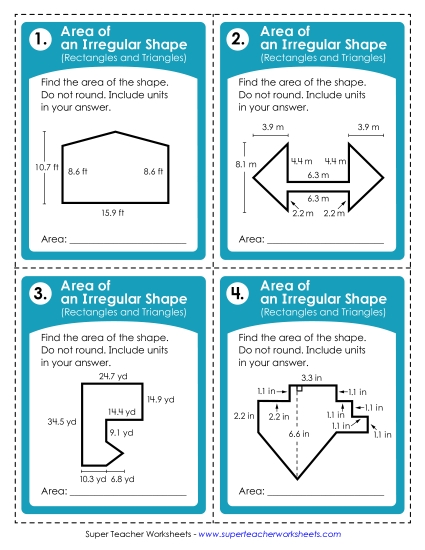
Find the areas of the 30 irregular shapes on these task cards. Each shape is made up of a combination of rectangles and triangles. Measurements include decimals and various units.
(added January 29, 2026)
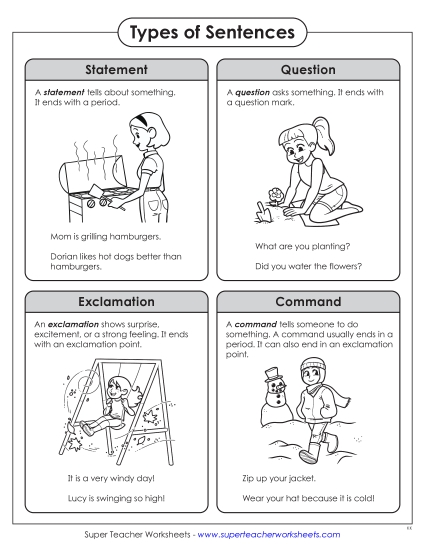
With this anchor chart, students can explore the differences between statements, questions, exclamations, and commands. Definitions and examples are given for each, along with a helpful visual aid students can color in.
(added January 29, 2026)
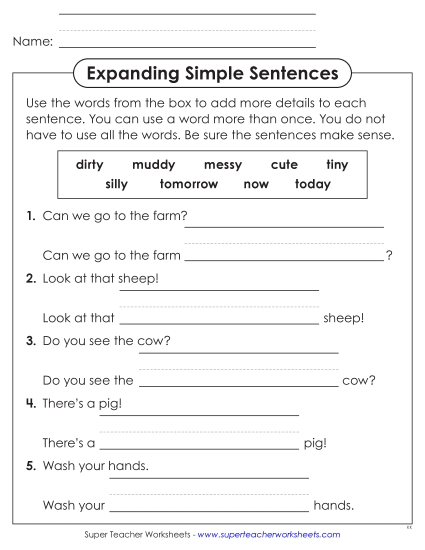
Early learners will use words from the bank to complete the sentences in ways that make sense. Words include dirty, messy, cute, tiny, tomorrow, now, today, and more.
(added January 29, 2026)
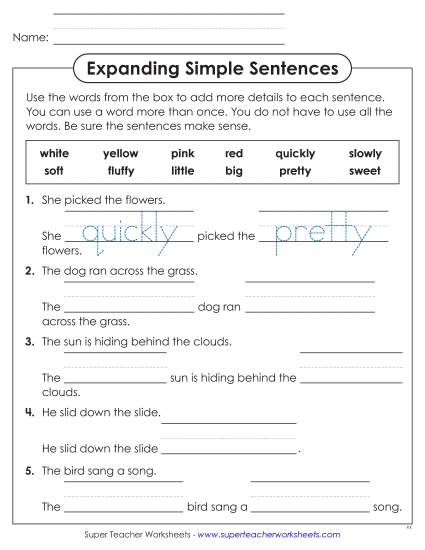
The word bank on this worksheet includes descriptive adverbs and adjectives such as fluffy, pink, little, quickly, and more. Students will have to choose words that make sense in the blank spaces to complete the sentences.


