
Measures of Center and Variability
Teach students about measures of center and variability with these statistics worksheets. They cover advanced concepts related to mean, median, and mode, as well as range, interquartile range (IQR), and mean absolute deviation (MAD).

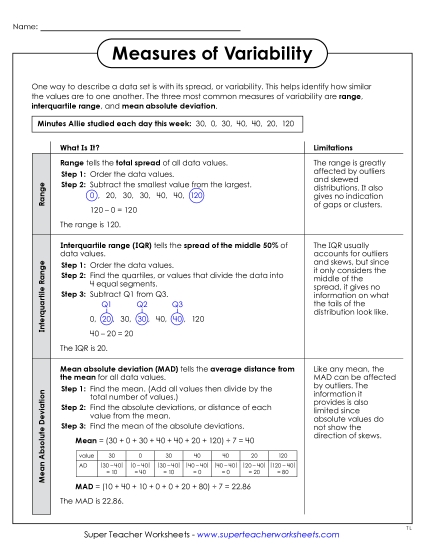
This printable guide provides examples, explanations, and limitations for the three most common measures of variability: range,
interquartile range (IQR), and mean absolute deviation (MAD).
interquartile range (IQR), and mean absolute deviation (MAD).
6th and 7th Grades


Filing Cabinet
Logged in members can use the Super Teacher Worksheets filing cabinet to save their favorite worksheets.
Quickly access your most used files AND your custom generated worksheets!
Please login to your account or become a member and join our community today to utilize this helpful feature.

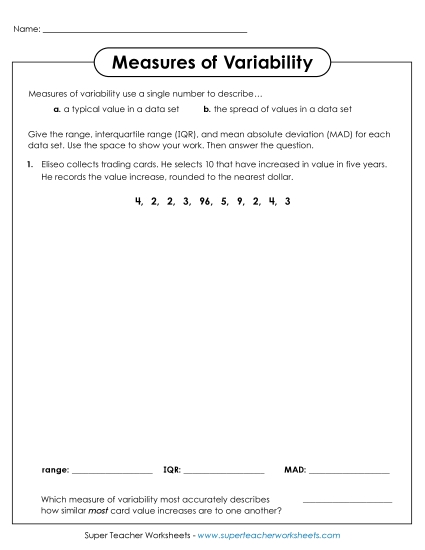
Use data sets to find range, interquartile range (IQR), and mean absolute deviation (MAD). Then determine which measures best describe certain data.
6th and 7th Grades
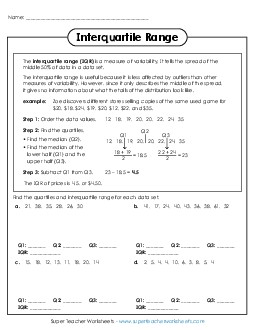
Learn about the uses and limitations of IQR with this helpful worksheet. Then find Q1, Q2, and Q3 for four sets of values and calculate their interquartile ranges.
6th and 7th Grades

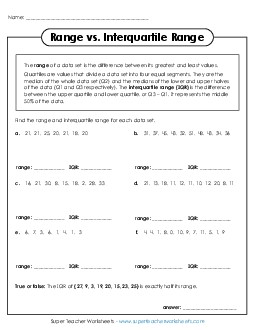
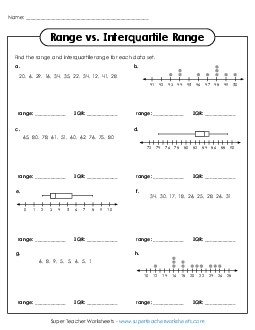
Students will find both range and interquartile range (IQR) for each of the given data sets on this worksheet.
6th and 7th Grades
This worksheet has 8 different data sets for which students can find both the range and IQR.
6th and 7th Grades
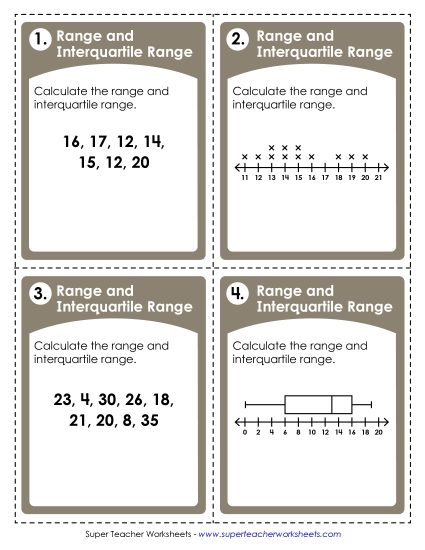
Use these task cards for games, learning centers, exit slips, or many other practice activities for range and interquartile range (IQR).
6th and 7th Grades
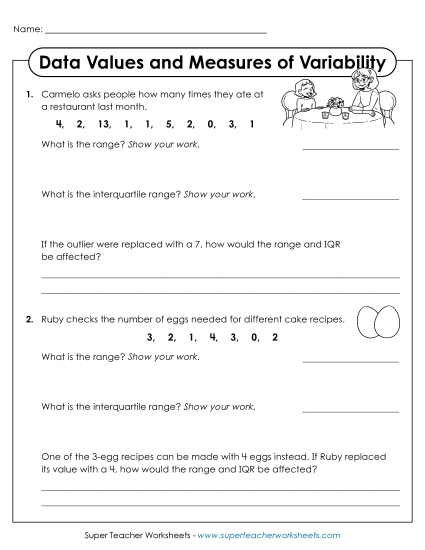
On this worksheet, students will find range and interquartile range of realistic data sets. They will also determine how these measures would be affected in certain situations.
6th Grade
Make box plots to represent given data and complete 5-number summaries.
6th and 7th Grades
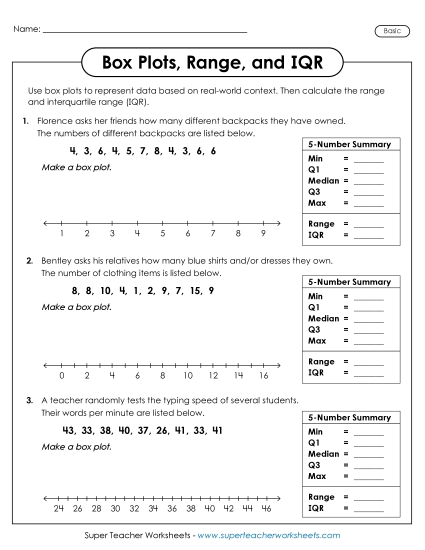
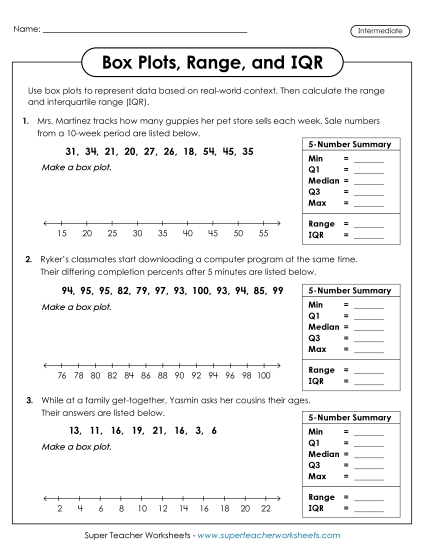
Make box plots based on the realistic word problems and data. Then use them to find the ranges and IQRs.
6th and 7th Grades
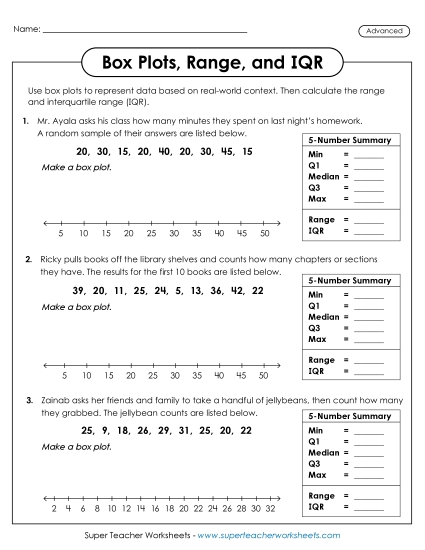
Practice making advanced-level box plots and 5-number summaries based on realistic data and word problems.
6th and 7th Grades
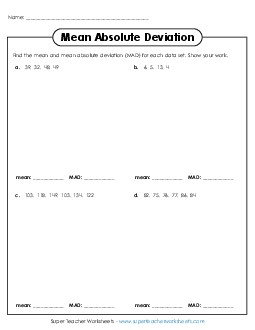
This mean absolute deviation worksheet includes practice data sets of varying sizes, from 4 to 8 values each.
6th and 7th Grades
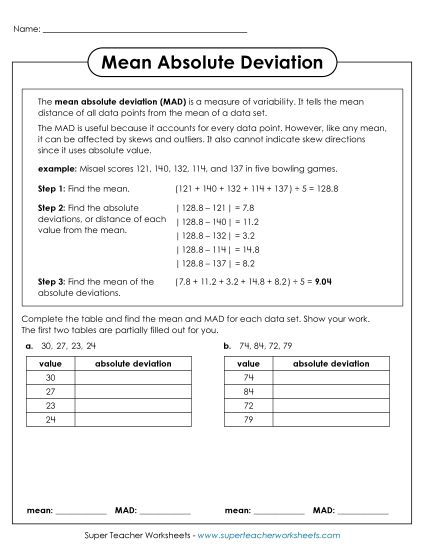
Learn how to find mean absolute deviation with a data set using a step-by-step breakdown. Then practice calculating the MAD for 6 different sets.
6th and 7th Grades
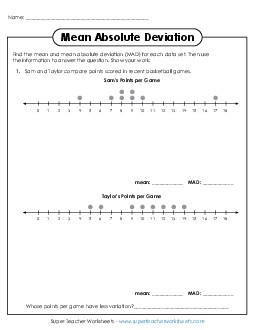
For both questions on this worksheet, students must interpret line plots and calculate the MAD and mean in order to compare two related data sets. Questions use real-world context.
6th and 7th Grades
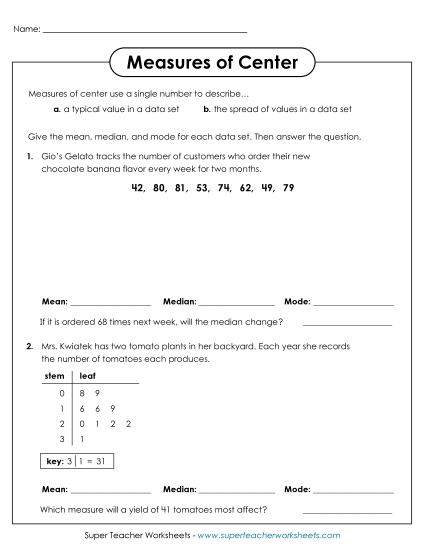
This worksheet presents four scenarios using stem-and-leaf plots, plain data sets, or dot plots. Find the mean, median, and mode for each. Then answer a question using the data.
6th and 7th Grades

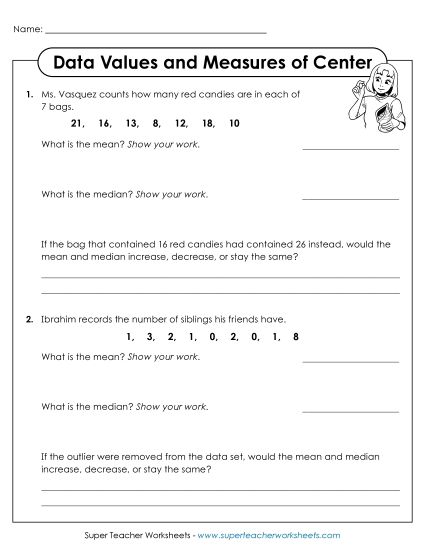
Explore how changing data values can impact means and medians in data sets.
6th Grade
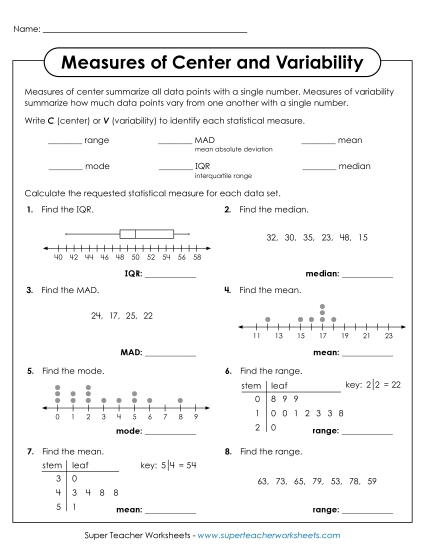
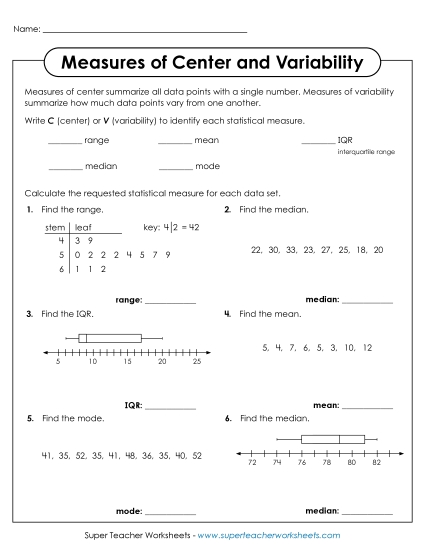
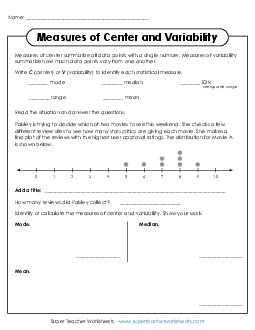
This worksheet includes covers mean, mode, median, range, interquartile range (IQR), and mean absolute deviation (MAD). First, students will identify whether the statistical measures summarize center or variation. Then they'll calculate each.
6th and 7th Grades
Use this worksheet to help students determine whether range, mean, median, mode, and interquartile range (IQR) are each measures of center or variability, and practice finding each of these measures.
6th and 7th Grades
With this worksheet, students will practice identifying and calculating the measures of center and variability: mean, median, mode, and range.
6th and 7th Grades
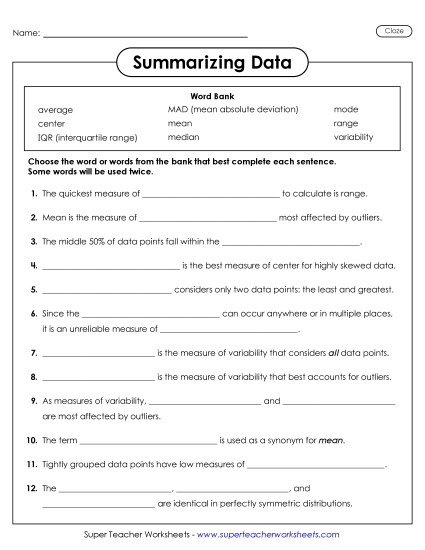
Students identify when to use median instead of mean (and vice versa), when different measures of center are the same, which measures of variation describe which types of data spread, and other details important for learning to summarizing data sets.
6th and 7th Grades
Use this worksheet to practice finding mean, median, mode, range, interquartile range (IQR), and mean absolute deviation (MAD).
6th and 7th Grades
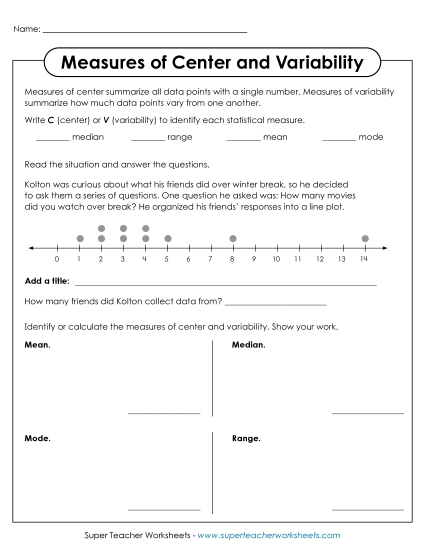
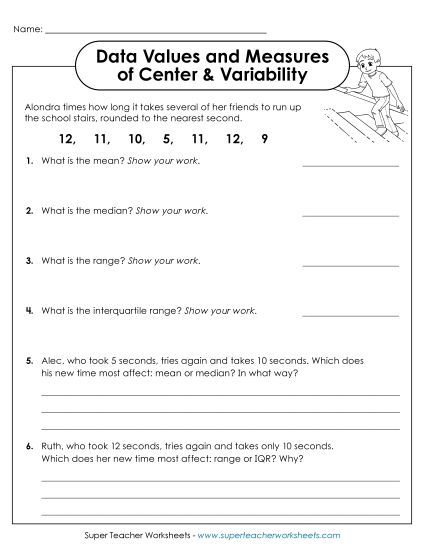
Print off this worksheet and have students practice finding mode, median, range, mean, and interquartile range (IQR). The worksheet includes a word problem and a dot plot.
6th and 7th Grades
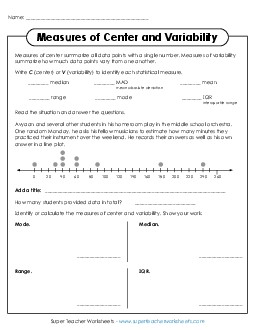
Practice finding mean, median, range, and IQR with a realistic scenario. Test your understanding of the data by answering two word problems about the effects of changes to the data.
6th Grade
Find worksheets on fundamental skills related to statistics here.
Mean, Median, Mode, and RangeThese worksheet focus on more basic skills related to mean, median, mode, and range.


