Super Teacher Worksheets

Line Plots

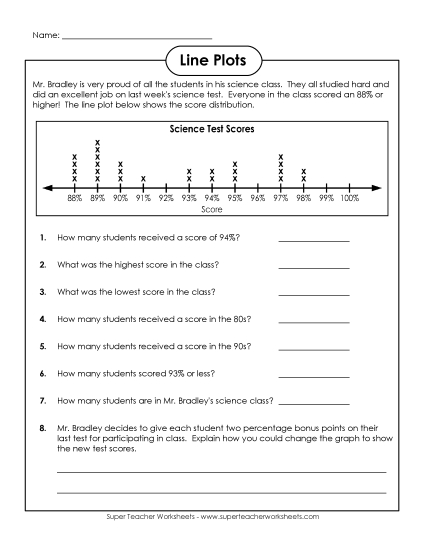
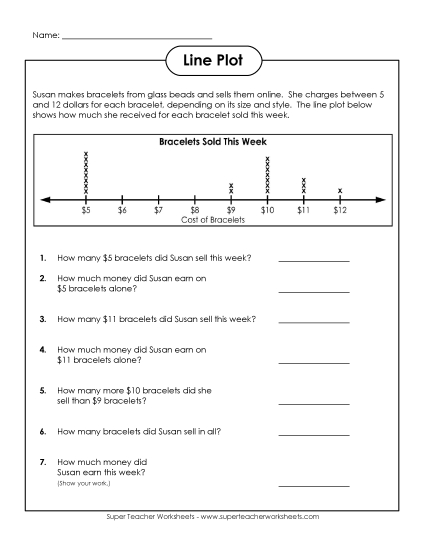
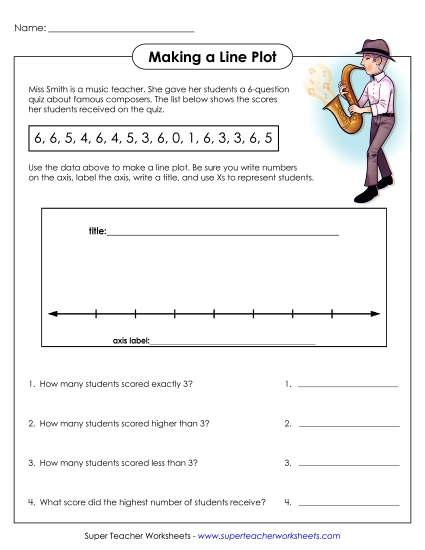
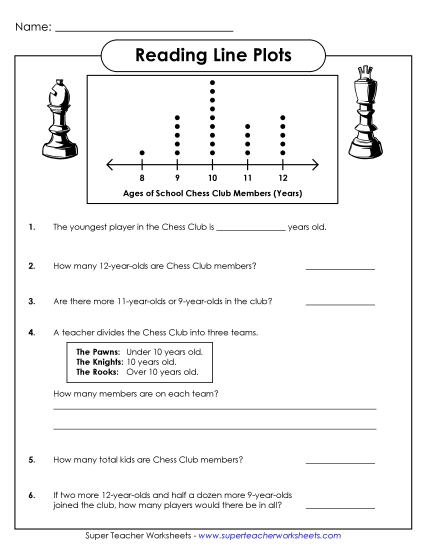
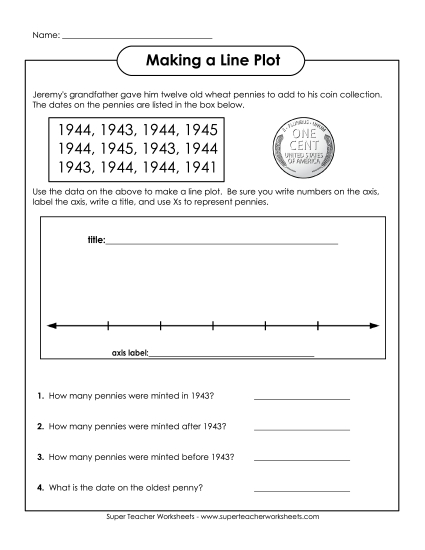
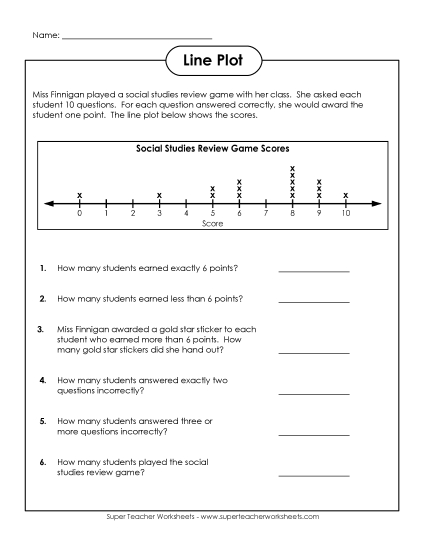
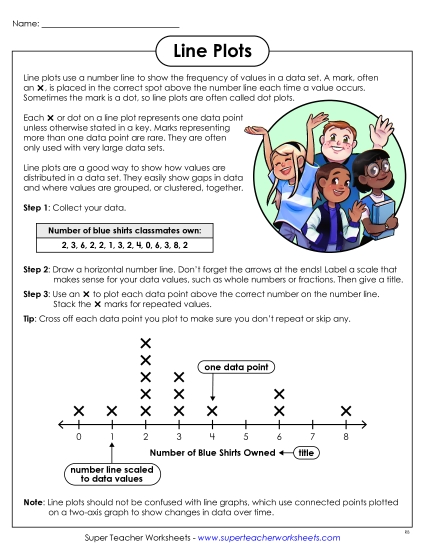
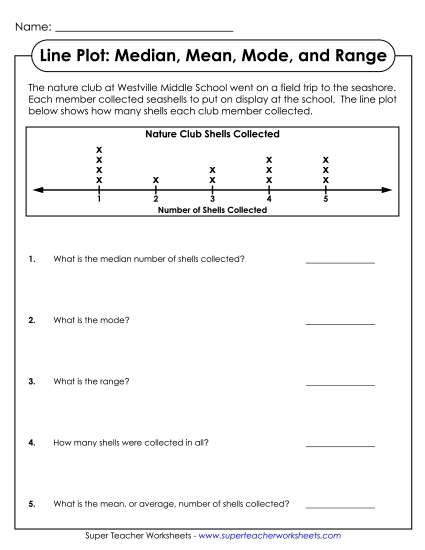
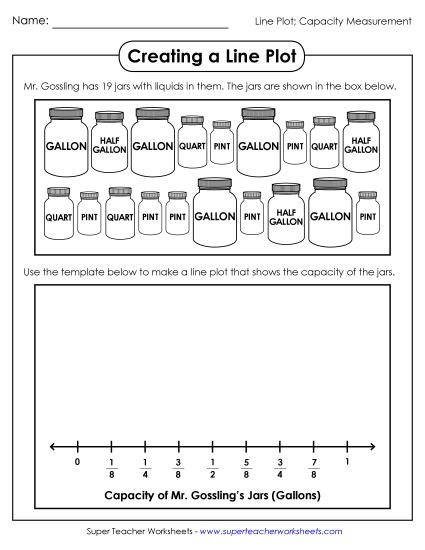
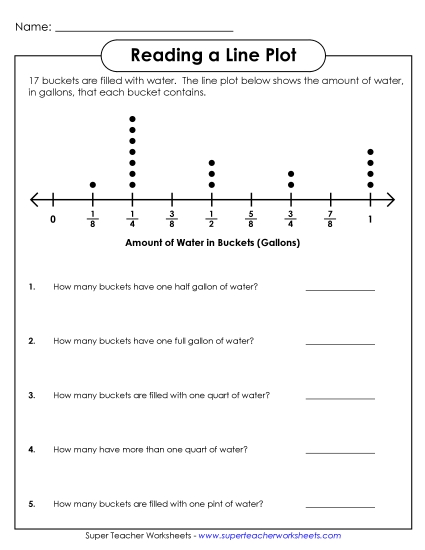
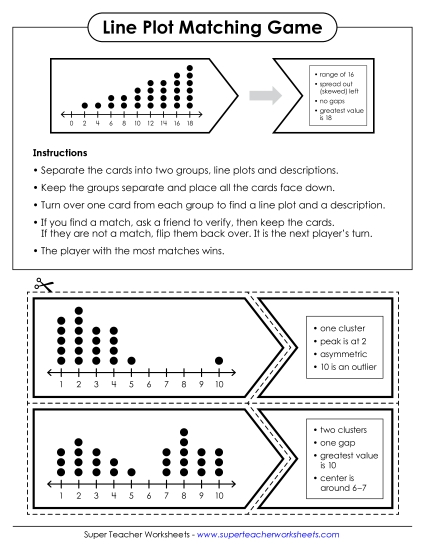
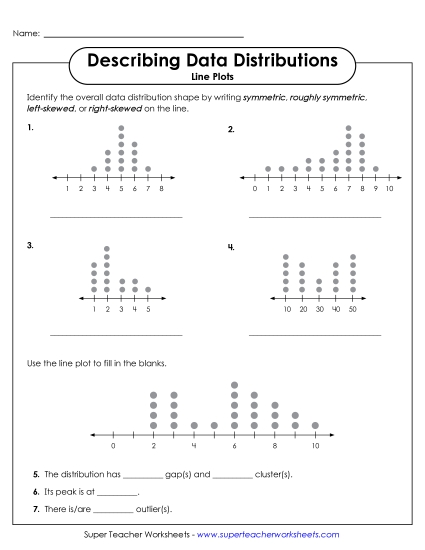
This page contains worksheets with line plots, a type of graph that shows frequency of data along a number line.

If you're looking for line graphs, please jump to the line graph worksheets page.

Line Plot Worksheets

Basic Line Plots

The line plot shows the scores students received on a science test. Use the data on the free graph to answer the questions. Grade 3 and up.
2nd through 4th Grades
aLine Plot: Science Scores
Common Core
Multiple Versions Available
Preview File
Members can add this to their file cabinet
This line plot data shows how many bracelets Susan sold. Use the data on the line plot to answer the questions. Grade 3 and up.
2nd through 4th Grades
aLine Plot: Bracelets
A music teacher gives her class a 6-question test about composers. Show her students' scores on a line plot. Grade 3 and up.
3rd and 4th Grades
aMake a Line Plot: Music
This 3-page worksheet packet will have students interpret data, create two line plots, and answer questions.
3rd through 5th Grades
aMake a Line Plot: Soccer Camp
This line plot (dot plot) shows ages of chess club members. Answer the questions using the plot/graph.
3rd and 4th Grades
aLine Plot: Chess Club
Jeremy's grandfather gave him a dozen wheat pennies. Make a line plot to show the dates on the pennies. Grade 3 and up.
2nd through 4th Grades
aMake a Line Plot: Pennies
This page has two line plots. Students use the data on the graphs to answer the questions.
4th and 5th Grades
aLine Plot: Aerobics
The line plot shows the number of points each student earned in a social studies review game. Answer the questions that follow. Grade 3 and up.
2nd through 4th Grades
aLine Plot: Social Studies Game

Anchor Chart

Print this free line plot anchor chart and keep a copy in every student's notebook. They'll never forget how to make a dot plot with these clear instructions and labeled example on hand! It even comes with a helpful reminder about the difference between line plots and line graphs.
2nd through 6th Grades
aDot Plot Anchor Chart

Advanced Line Plots

Plot the mean, median, mode, and range of the data shown on the line plot. Grades 4 and up.
3rd and 4th Grades
aLine Plot: Mean Median, Mode
Make a line plot to show how many of each jar are in a set. This activity requires students to have a basic understanding of capacity measurement. They'll need to convert quarts and pints into fractional units of a gallon. (example: 1 quart = 1/4 of a gallon)
5th through 7th Grades
aMake a Line Plot:<br>Capacity (Gallons, Quarts, Pints)
A line plot shows the amount of water in 17 buckets. This lessons requires knowledge of standard units of capacity (gallons, quarts, and pints).
5th and 6th Grades
aLine Plot: Capacity/Fractions
Turn statistics into a game with this printable file. One card uses descriptions like peak is at 2 and 10 is an outlier that pair with one of 22 dot plots. Try to pair them together correctly!
6th and 7th Grades
aLine Plot Matching Game
Show off your statistics vocabulary to describe these line plots in terms of symmetry, gaps, outliers, peaks, and more. Page 2 includes roughly identifying the median center and calculating range.
6th Grade
aDescribing Data Distributions:<br>Line Plots
On this worksheet, students are given line plots and histograms and must describe the data shown by them.
6th and 7th Grades
aDescribing Data Distributions: <br>Line Plots & Histograms
Students will have to determine which statement about each line plot or histogram is true in regard to the data distribution.
6th Grade
aTask Cards: Line Plots and Histograms

See Also:

Pictograph Worksheets

Pictographs use symbols to show data.

Line Graph Worksheets

Line graphs (not to be confused with line plots) have plotted points connected by straight lines.

Pie Graph Worksheets

Pie graphs, or circle graphs, show percentages or fractions of a whole group.

Bar Graphs

Students can practice creating and interpreting bar graphs on these printable worksheets.

Sample Worksheet Images

Line Plot Graphs (Printable)

Line/Dot Plot Worksheets

Graph Worksheets (Line Plot)

Please Log In to Super Teacher Worksheets
Username:
Password:
Can't remember your password?
Not a member yet? Join Today!
Become a Member
Social Media
Follow Us
facebook
Twitter
Pinterest
Instagram
Not a Member?
For complete access to thousands of printable lessons click the button or the link below.
© 2025 Super Teacher Worksheets

PDF with answer key:

PDF no answer key:

Common Core Alignment
Preview