Describing Data Distributions: Line Plots Printable PDF Worksheet
Describing Data Distributions: Line Plots
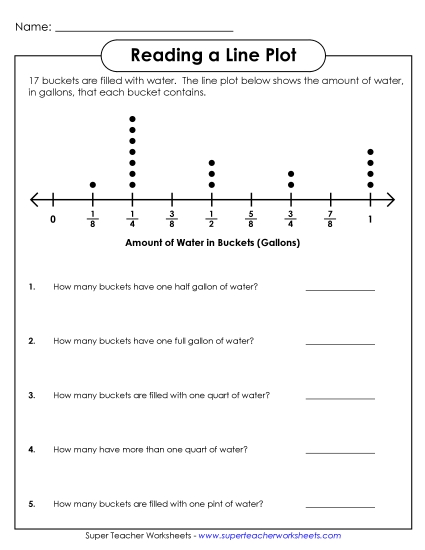
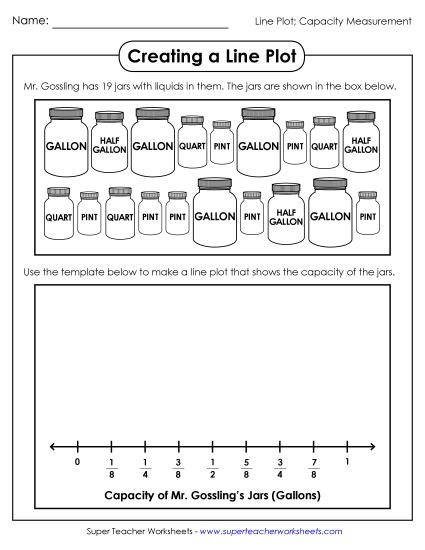
Enhance your 6th grade students' understanding of statistics with our "Describing Data Distributions Line Plots" printable PDF worksheet. Ideal for classroom instruction or homework, this resource offers engaging activities designed to teach and review key concepts like symmetry, gaps, outliers, and peaks. The worksheet also guides students in identifying median centers and calculating ranges, helping them build essential skills through practice problems and answers. A fun and effective learning tool for elementary teachers and homeschoolers!
This worksheet is recommended for students in Sixth Grade.
- Common Core Standards
6.SP.26.SP.5a6.SP.5c
")

You May Also Be Interested In