Free Dot Plot Anchor Chart Printable Line PDF Worksheet
Dot Plot Anchor Chart
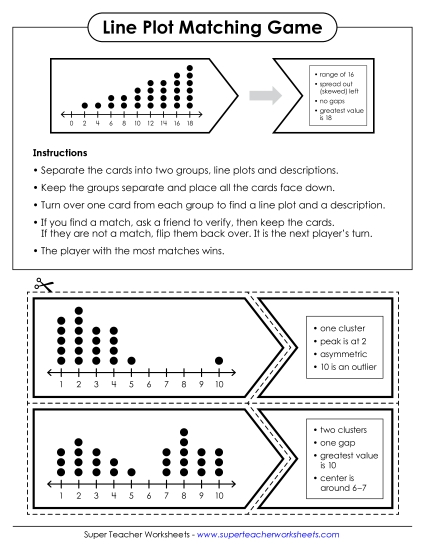
Enhance your classroom teaching tools with our Dot Plot Anchor Chart, designed for students in grades 2 to 6. This printable PDF serves as a valuable resource to help teach and review key skills in creating dot plots. Clear instructions and labeled examples make learning fun and easy, while also distinguishing dot plots from line graphs. Ideal for classroom instruction, homework, or as a study aid, this anchor chart engages students in practicing and understanding data representation.
This worksheet is recommended for students in Second Grade, Third Grade, Fourth Grade, Fifth Grade, and Sixth Grade.
- Common Core Standards
2.MD.93.MD.44.MD.45.MD.26.SP.4
")
You May Also Be Interested In