
Frequency Tables
Use these worksheets to help your students gain practice with creating and interpreting frequency tables.

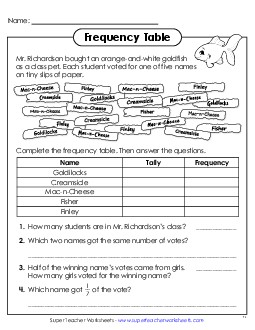
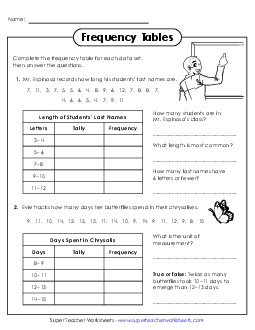
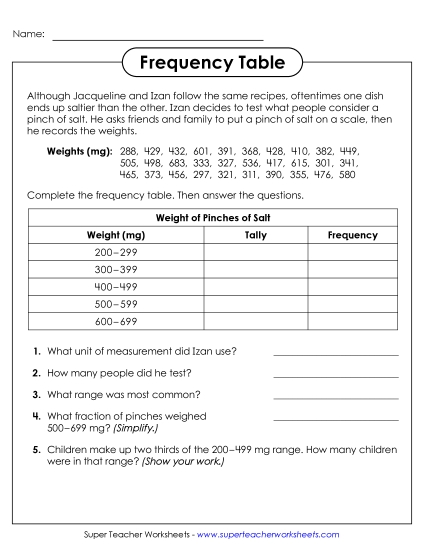
This very basic frequency table activity is perfect for students just learning about frequency tables. They'll complete the table based on the information provided and answer the questions that follow.
4th through 6th Grades


Filing Cabinet
Logged in members can use the Super Teacher Worksheets filing cabinet to save their favorite worksheets.
Quickly access your most used files AND your custom generated worksheets!
Please login to your account or become a member and join our community today to utilize this helpful feature.

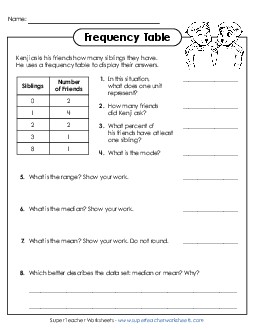
Test your students' ability to interpret a frequency table with this worksheet. The provided table shows how many siblings Kenji's friends have. Students will use this data to find the mode, range, median, and mean, and answer other questions.
5th and 6th Grades
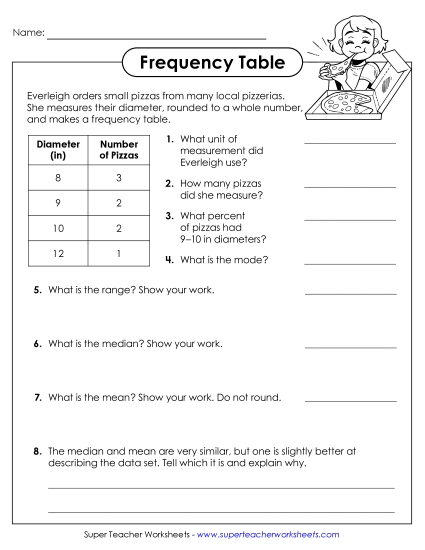
Test your students' understanding of a frequency table with this worksheet where students must answer questions about the data in a completed table.
6th Grade

This informative printout shows how to create a frequency table from given data. Students will review an example and then fill in their own frequency tables using the outlined information provided.
6th Grade
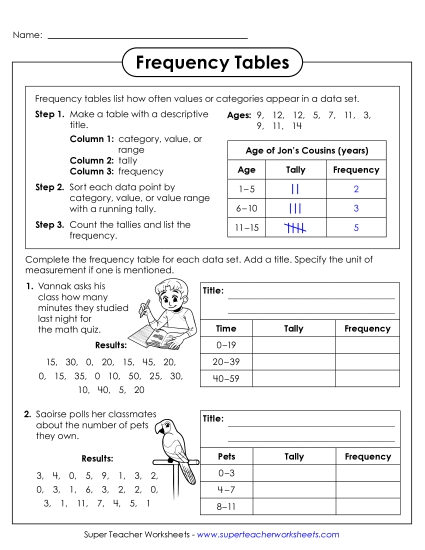
Students are given all the information they need to make two frequency tables. After making the tables, they will also be able to answer several questions about the data.
4th through 6th Grades
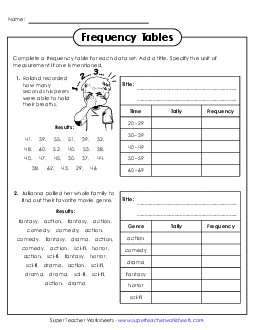
Give your class more practice with frequency tables with this printable packet. Results are given for four realistic data sets. Students must complete the frequency tables, including titling them, for each.
4th through 6th Grades
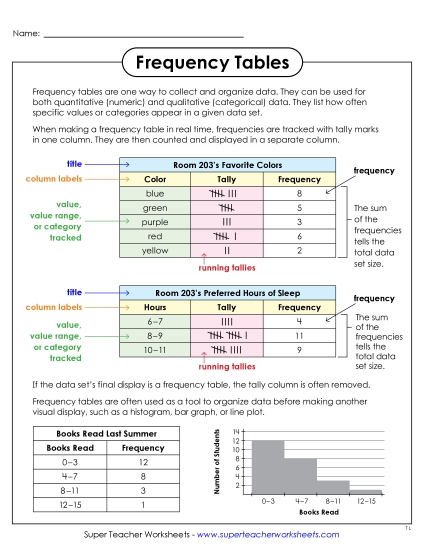
This anchor chart shows how to accurately display data in a frequency table, providing examples and clear explanations.
4th through 6th Grades
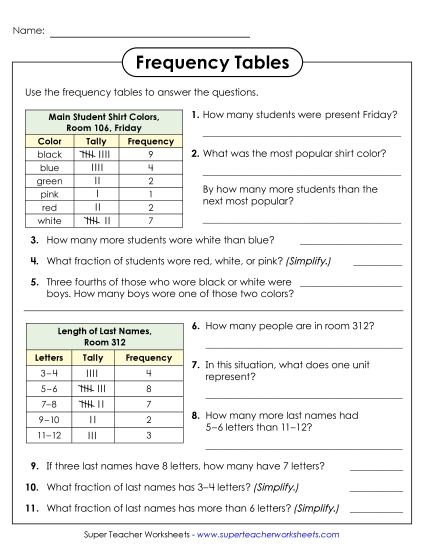
Students will have to read and interpret the frequency tables in order to answer the questions about the data.
4th through 6th Grades
Students are given data that they must organize into a frequency table. Then they must answer questions about the information.
6th Grade
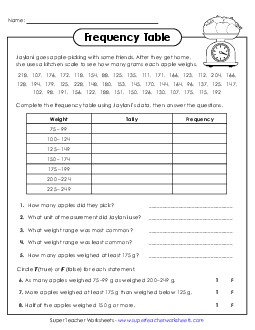
Create a frequency table using the data given about the weights of apples a group of friends picked. Then answer the questions about the data.
4th through 6th Grades
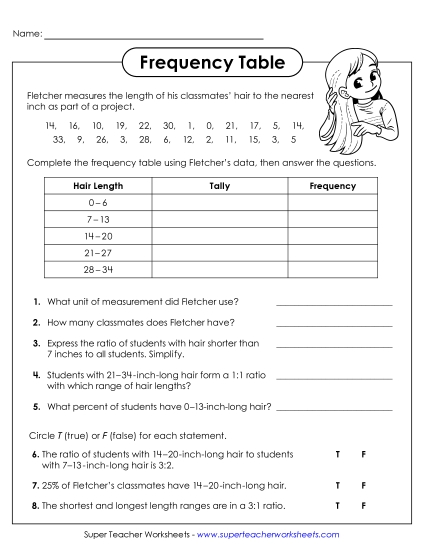
Complete the frequency table and answer the questions that follow. Questions cover calculating percentages and expressing ratios.
6th Grade
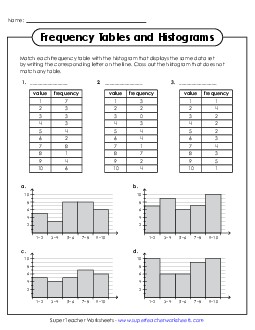
To complete this worksheet, students have to be able to interpret both frequency tables and histograms, matching each of the frequency tables to the correct histogram and identifying the histogram that doesn't match a frequency table.
6th Grade
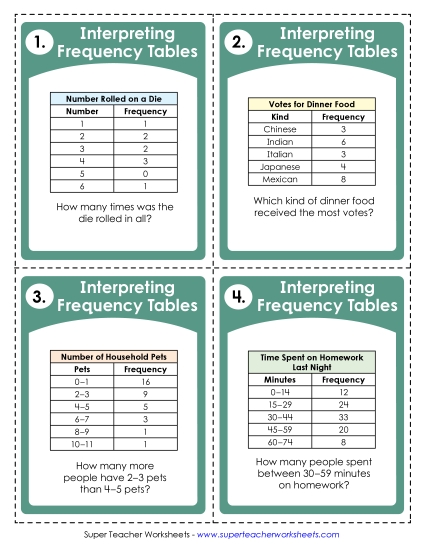
Each task card includes a completed frequency table. Students must answer a question about the data shown. Tables cover realistic data students can relate to, such as number of household pets and time spent on homework.
6th Grade
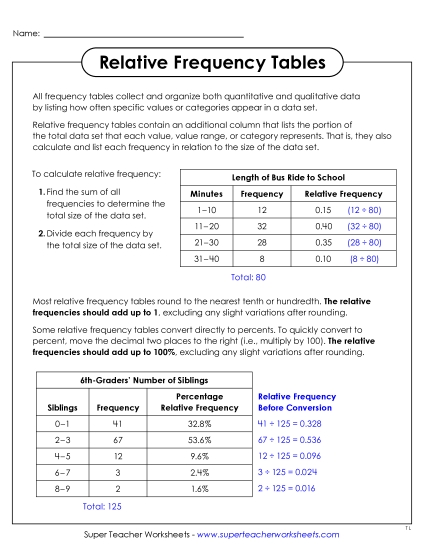
This printable guide gives an overview of relative frequency tables, as well as examples.
6th Grade
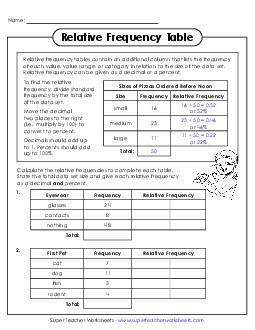
This worksheet explains how to make relative frequency tables, providing an example and detailed description. Students will calculate the relative frequencies and use data to complete four tables.
6th Grade
Given the frequencies for each response, students will have to calculate the totals and complete the relative frequency tables.
6th Grade
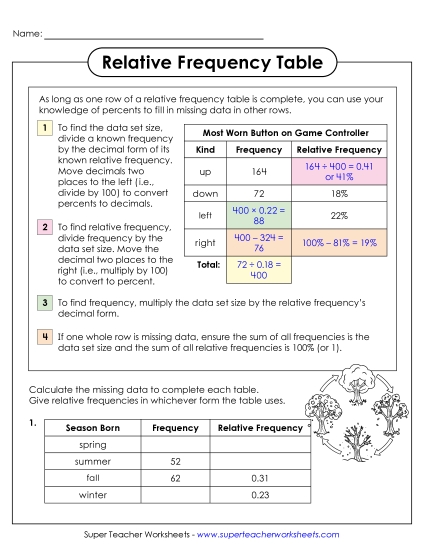
Show students that all they need is one completed row of a relative frequency table to be able to finish it; they just need to use their knowledge of percents! This worksheet includes a detailed example and explanation, as well as four incomplete tables for learners to work on.
6th Grade
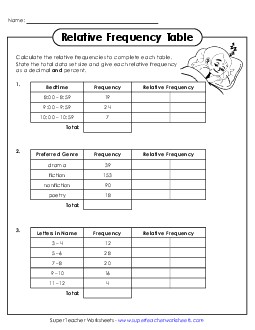
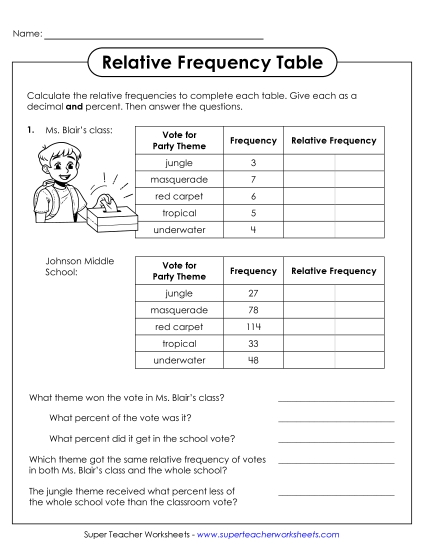
Students will practice calculating relative frequency and completing the relative frequency tables. They'll also answer several questions about the information in the tables.
6th Grade
Looking for more practice with histograms, the visual display that pairs with most frequency tables? Click here!
Bar GraphsFollow this link for more bar graph practice worksheets, with and without frequency tables or tally charts.
Graphing WorksheetsExplore the complete STW collection of worksheets on visual displays of data.


