
Histograms
Our collection of histogram worksheets helps students learn how to read and create this type of graph. Using given data, students can fill in histograms on their own and answer questions interpreting them.

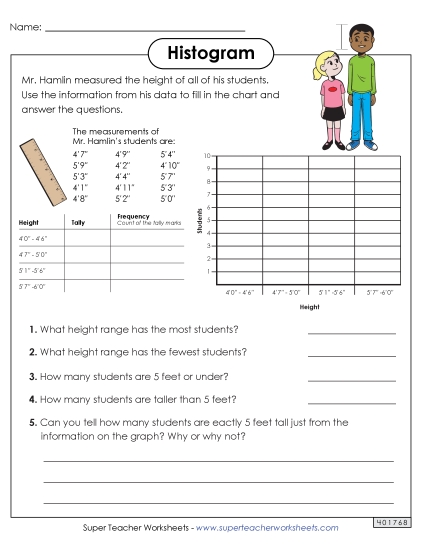
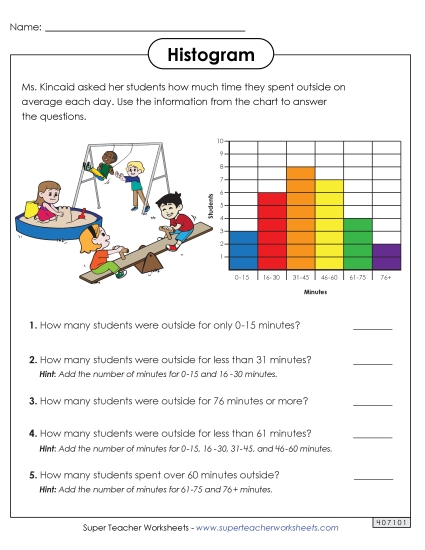
Students can use the data to fill in the histogram and then answer the questions about it to ensure they understand the information on this free activity.
5th and 6th Grades


Filing Cabinet
Logged in members can use the Super Teacher Worksheets filing cabinet to save their favorite worksheets.
Quickly access your most used files AND your custom generated worksheets!
Please login to your account or become a member and join our community today to utilize this helpful feature.

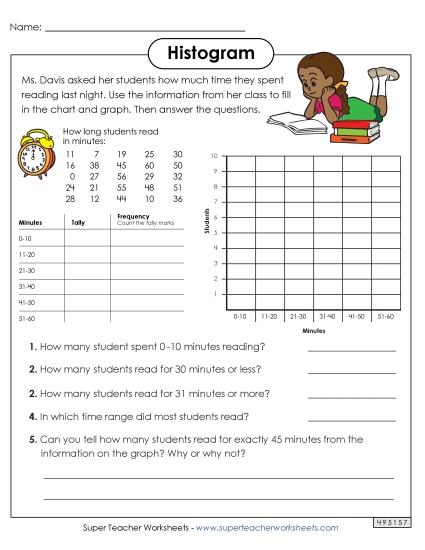
Students will create a histogram based on data provided about how long students read one night. Then they will answer questions about the graph and data.
5th and 6th Grades
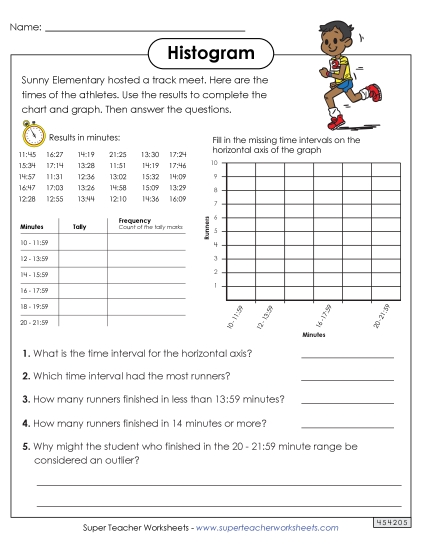
With this worksheet, students can make a histogram using data provided about a track meet. Then they can answer questions regarding their graph and the data.
5th and 6th Grades
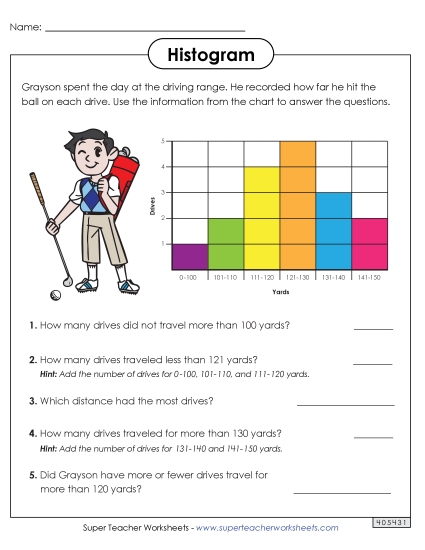
This histogram has information on a person's results from golfing at the driving range. Test your students' ability to understand histograms by having them complete this worksheet.
5th and 6th Grades
Use this worksheet to help students practice interpreting the information presented in a histogram.
5th and 6th Grades
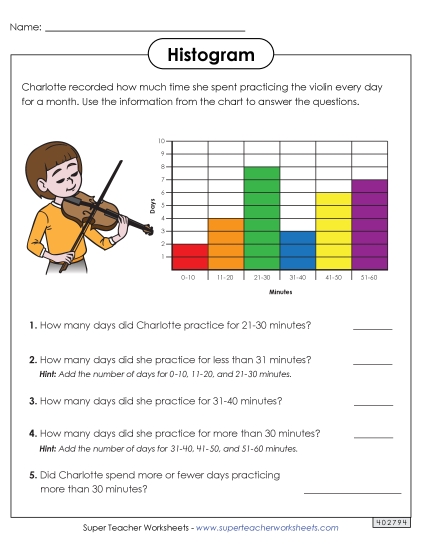
With this worksheet, students will use the provided histogram to answer questions about how long a student practiced her violin.
5th and 6th Grades
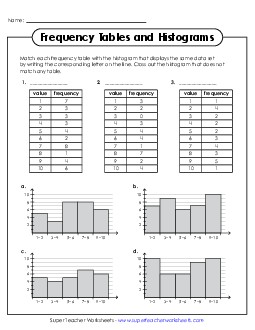
Students must be able to read both frequency tables and histograms to complete this worksheet. They must match each of the three frequency tables to the corresponding histogram and identify the histogram that does not match any of the frequency tables.
6th Grade
View the distribution of data shown by either a line plot or histogram and answer questions about the data.
6th Grade
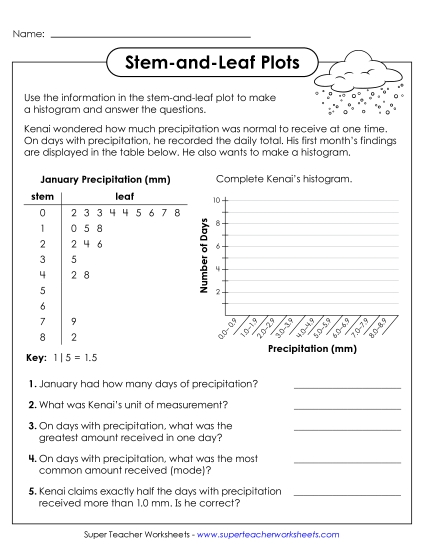
Challenge your students to create a histogram using data presented in a stem and leaf plot. Then use your plot and graph to answer a few questions.
5th and 6th Grades
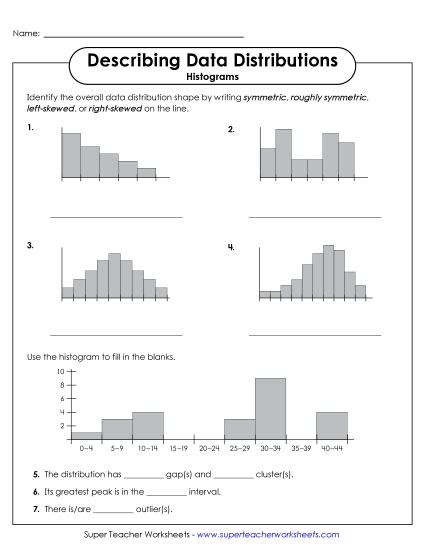
Practice advanced histogram skills like identifying symmetry and skews, gaps and clusters, and outlier bins. The second page of this 2-page worksheets includes histograms with situational context.
6th and 7th Grades
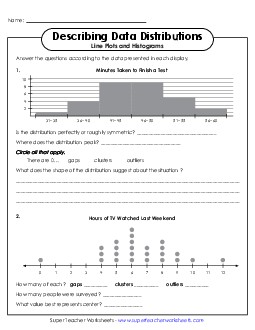
Review the line plots and histograms to describe the data shown.
6th and 7th Grades
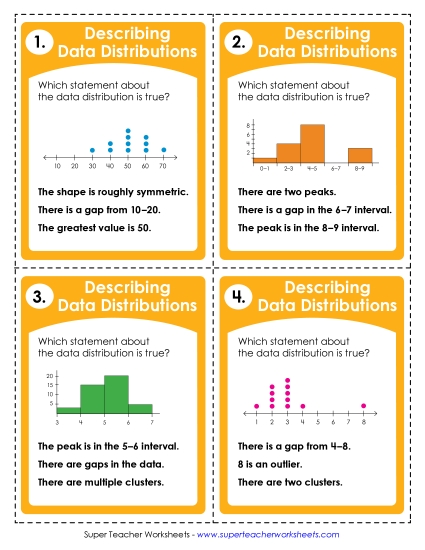
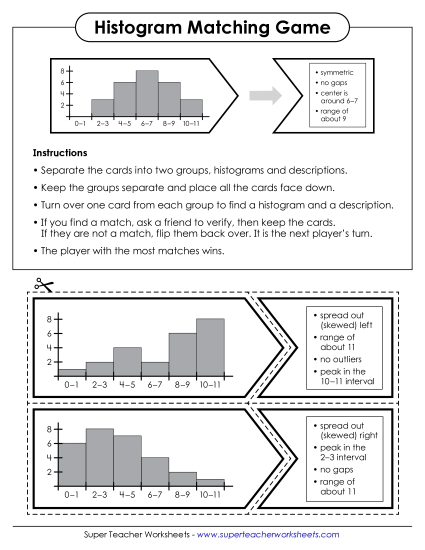
This challenging but fun game will have your students describing histograms in no time! Cut out the pieces, then match histograms with the descriptions that accurately describe their attributes, including skews, peaks, presence of outliers, and more.
6th and 7th Grades
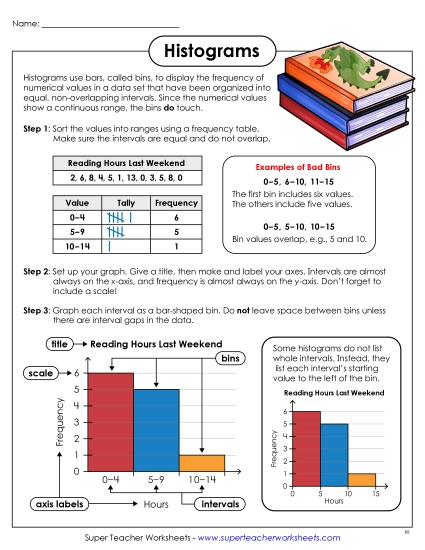
How do you make a histogram? What are the parts of a histogram called? Print this histogram reference chart for your students and they'll have the answers! Includes detailed instructions and two versions of histogram axis labels.
5th through 7th Grades
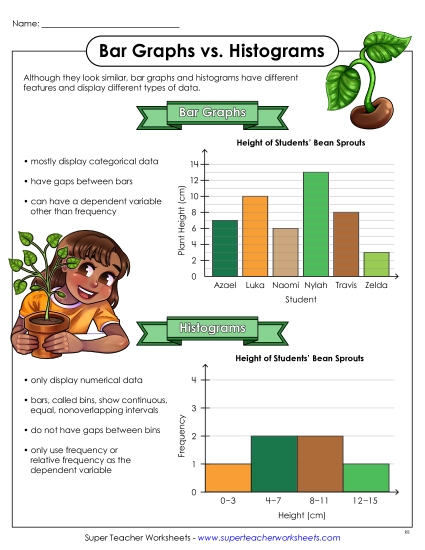
Students will never confuse a histogram for a bar graph again when they have they helpful reference chart! Use the side-by-side colorful models and helpful descriptions to remember the differences between bar graphs and histograms.
5th through 7th Grades
Learn to read and interpret data on bar graphs with these printable PDFs.
More Graphing WorksheetsPractice reading and creating bar graphs, line graphs, line plots, pictographs, and pie graphs.


