Box and Whisker Plots
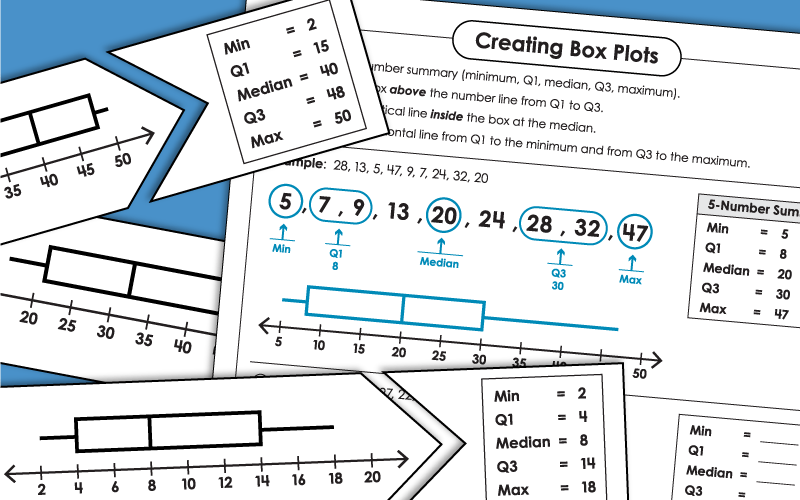
Box plots (also known as box and whisker plots) are used in statistics and data analysis. They are used to show distribution of data based on a five number summary (minimum, first quartile Q1, median Q2, third quartile Q3, and maximum).
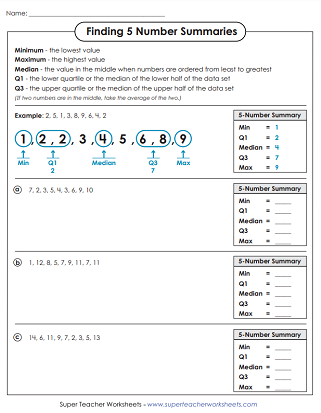
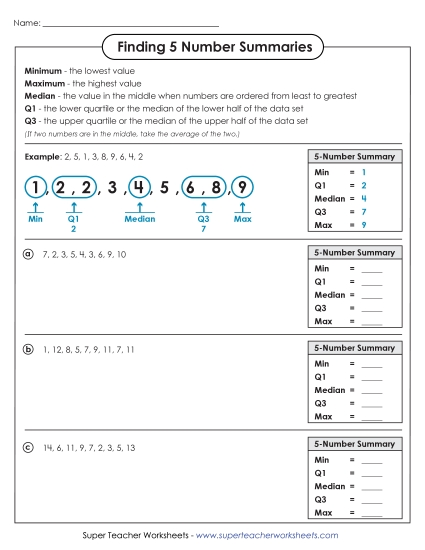
Students are given sets of numbers. They'll need to find the minimum, maximum, median, Q1, and Q3. This basic level free worksheets includes whole numbers 0-20.
6th and 7th Grades




Filing Cabinet
Logged in members can use the Super Teacher Worksheets filing cabinet to save their favorite worksheets.
Quickly access your most used files AND your custom generated worksheets!
Please login to your account or become a member and join our community today to utilize this helpful feature.

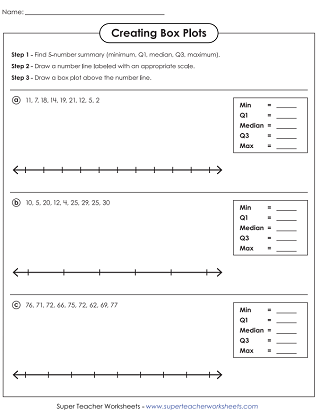
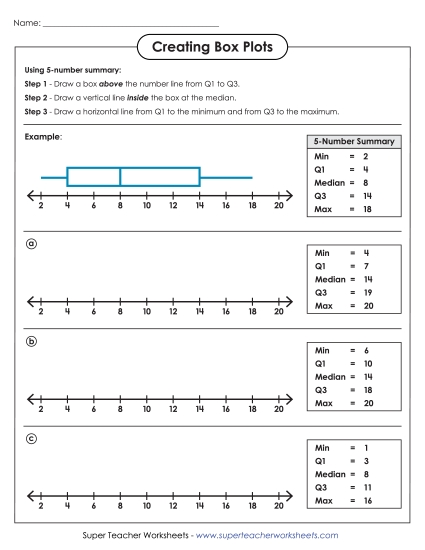
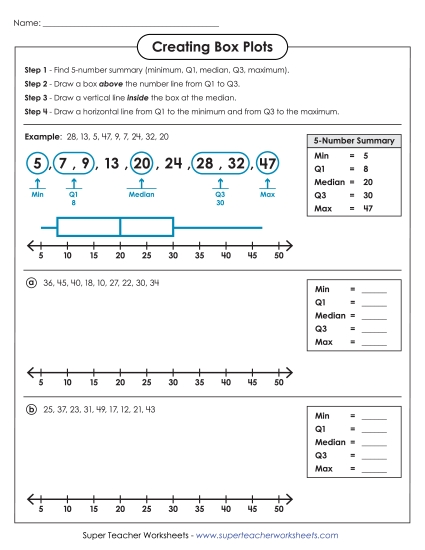
Students are given the Q1, Q3, minimum, maximum, and mean. They use these numbers, along with a number line, to make a simple box and whisker plot.
6th and 7th Grades
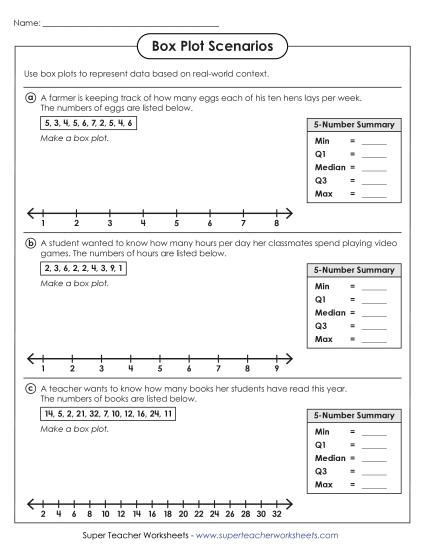
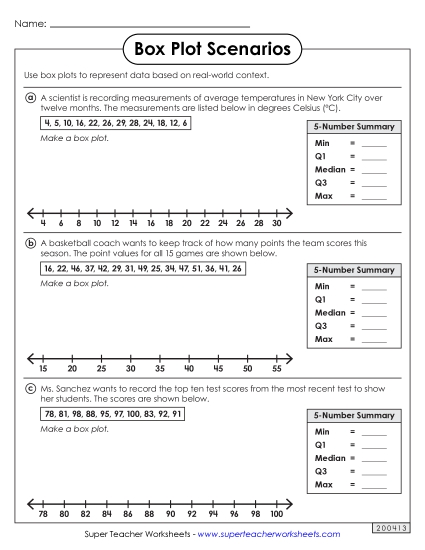
Complete a 5NS and a BP for each word problem scenario.
6th and 7th Grades
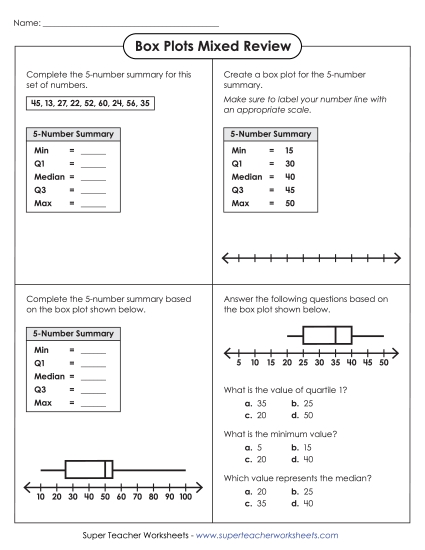
Complete a 5-NS, create a BP, and answer the multiple choice questions.
6th and 7th Grades

Practice making box plots and 5-number summaries using the provided data.
6th and 7th Grades
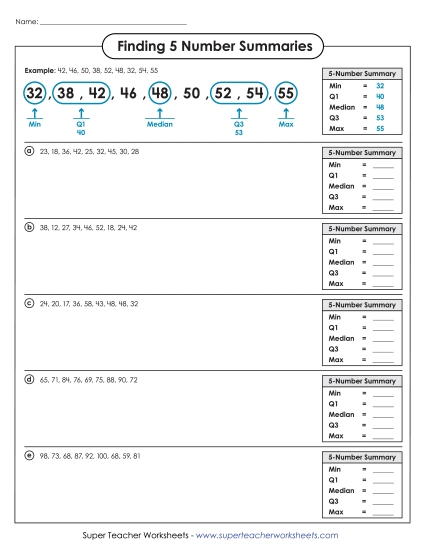
Students are given five sets of 9 numbers. For each set, they are to find the median, Q1, Q3, minimum, and maximum. This intermediate-level worksheet has numbers between 0 and 100.
6th and 7th Grades
Use the numbers given to create a box plot with whiskers. This version has 2-digit numbers. Numbers range from 0 to 100.
6th and 7th Grades
These box plot problems have real word scenarios. Read each and draw a BP. Number range 0-100.
6th and 7th Grades
This worksheet has 4 different types of B.P. problems to complete.
6th and 7th Grades
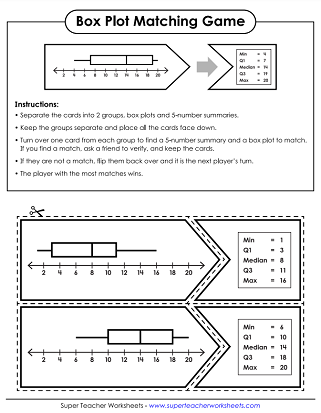
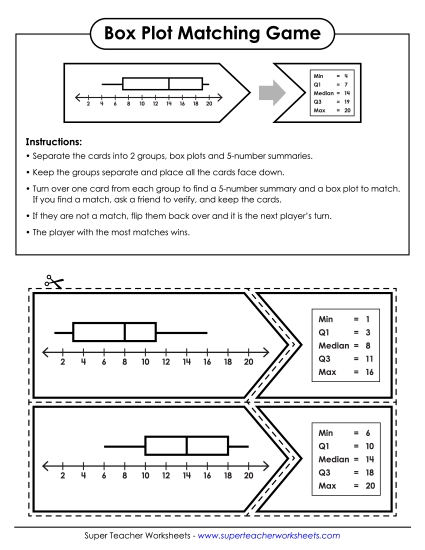
Cut out the puzzle pieces. Match each box plot with the correct 5-number summary. Numbers range from 0 to 100.
6th and 7th Grades
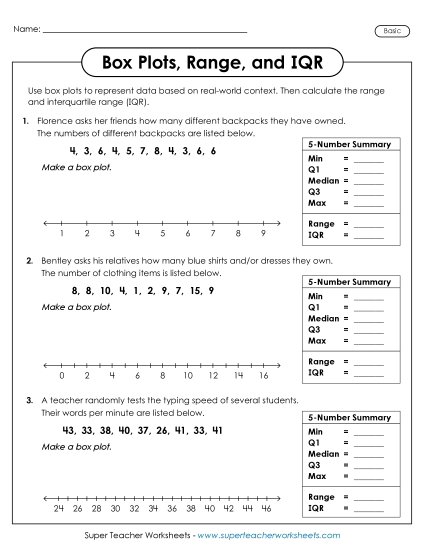
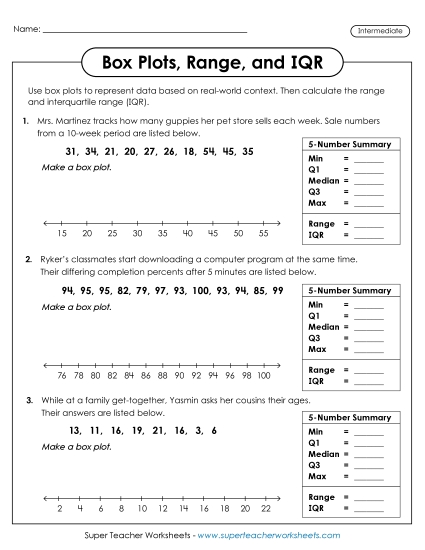
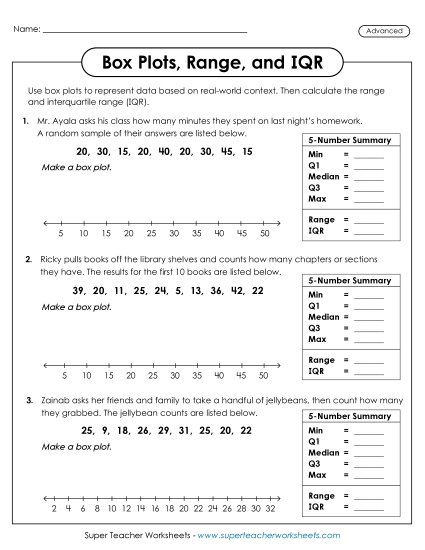
Represent data using box plots based on real-world word problems. Then calculate the range and IQR.
6th and 7th Grades
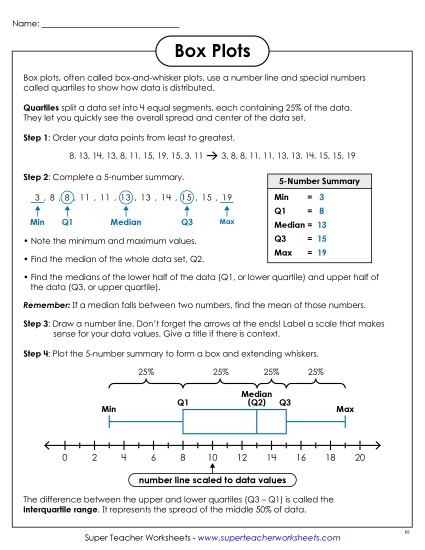
Learn how to make a box plot by following these 4 steps, from raw data to finished plot with scale and title. Box plot reference chart includes an overview of 5-numbary summaries, how to find median and quartiles, and finding IQR (interquartile range).
6th and 7th Grades
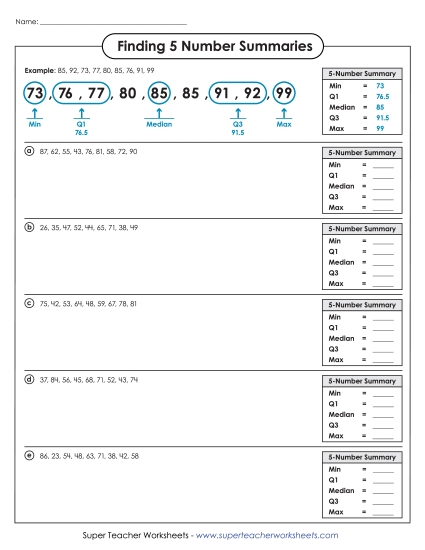
Students are given five sets of numbers. The must determine the maximum, minimum, Q1, Q3, and the median. This advanced-level worksheet has some medians with decimals.
6th and 7th Grades
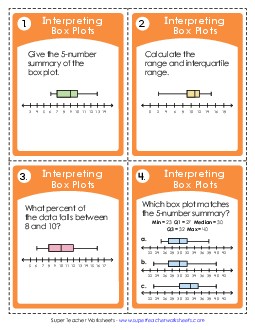
With these task cards, students will practice giving 5-number summaries of box plots, calculating range and interquartile range, finding the percent of data between two numbers, and more.
6th and 7th Grades
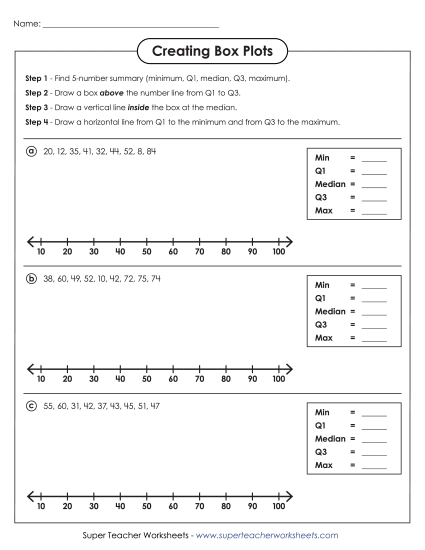
Use the given values to create 5-digit summaries and then generate box plots. This version has a scale printed on the number line.
6th and 7th Grades
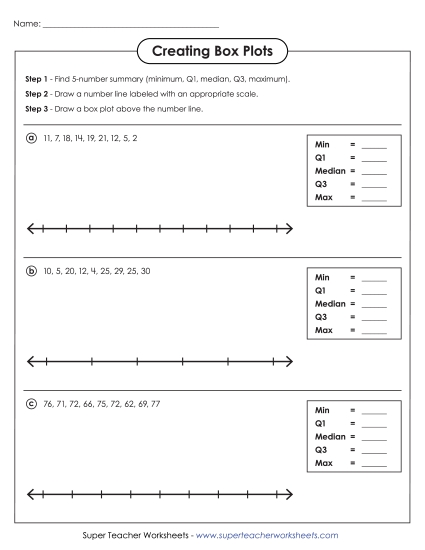
Use the data shown to assemble a 5-dig summary and then neatly craft a box plot. In this version, students needs to also label the number line with an appropriate scale.
6th and 7th Grades
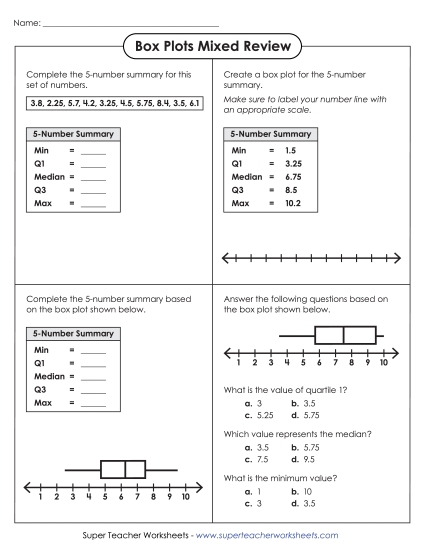
There are four Box-Whisker Plot problems on this page to solve. This level has decimal numbers.
6th and 7th Grades
This worksheet uses word problems with realistic data for students to make box plots out of and find the 5-number summaries.
6th and 7th Grades
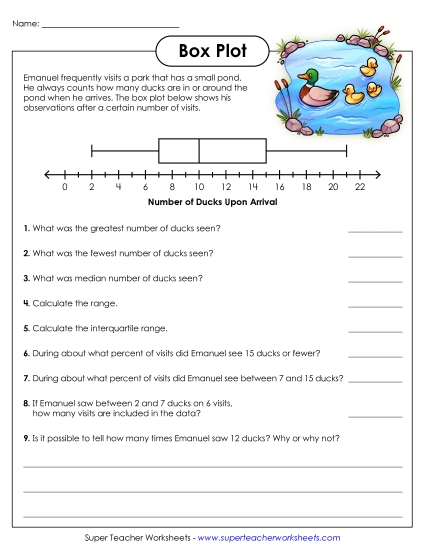
Interpret and analyze a box plot with real-world context. Identify least and greatest values, calculate the range and interquartile range, use quartile to describe percentages of the data, and explain the limitations of box plots when it comes to data specificity.
6th and 7th Grades
We have many middle school math topics, including surface area, inequalities, volume, basic algebra, and more.