Stem-and-Leaf Plot Worksheets
These practice worksheets will help your students learn to read and make stem and leaf plots. Advanced worksheets include analysis of data presented in stem and leaf plots and two-sided stem and leaf plots.

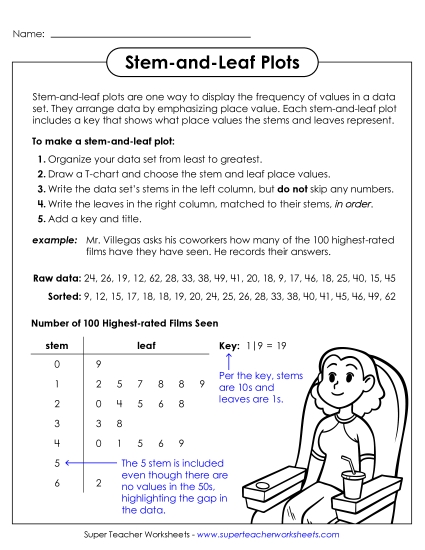
Print this detailed anchor chart for students to use as a reference sheet. It includes step-by-step instructions on how to make a stem and leaf plot with a full example. An optional second page gives further examples of using decimals and double-digit stems.
5th and 6th Grades

Filing Cabinet
Logged in members can use the Super Teacher Worksheets filing cabinet to save their favorite worksheets.
Quickly access your most used files AND your custom generated worksheets!
Please login to your account or become a member and join our community today to utilize this helpful feature.

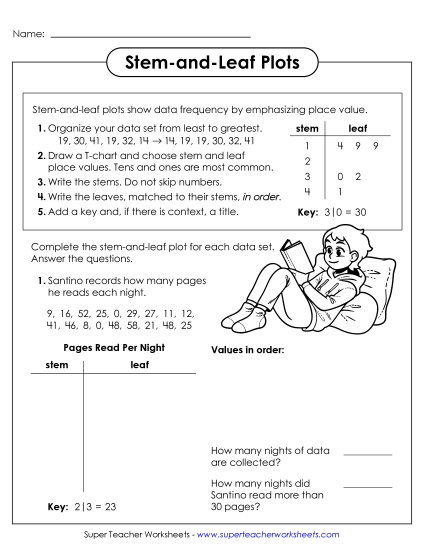
Practice turning raw data into a stem-and-leaf plot. Worksheet contains 3 sets of values, space to order them, and pre-made t-charts with a key. Identify the number of values collected and answer one question for each data set.
5th and 6th Grades


This 2-sided worksheet asks students to correctly read two sets of stem and leaf plot values. Then it asks students to create stem and leaf plots for two sets of data, including specifying a key. Space is given to order the values first.
5th and 6th Grades
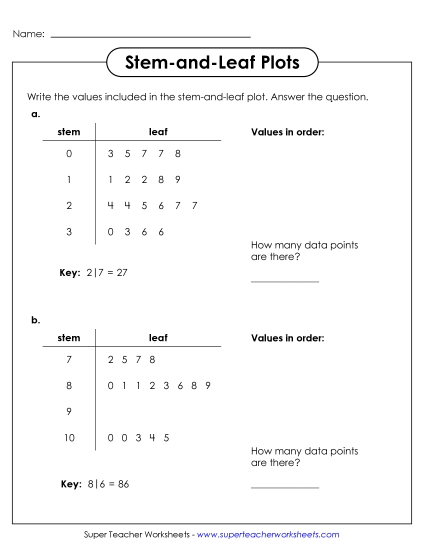
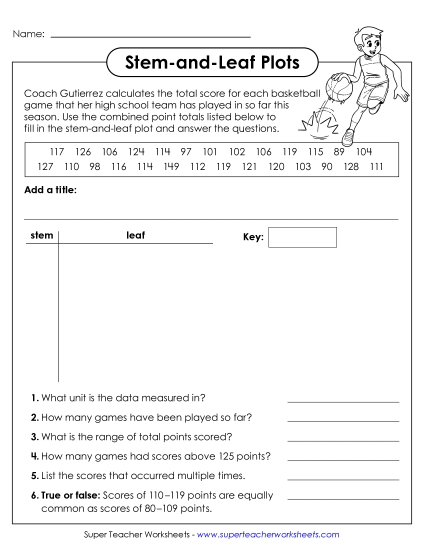
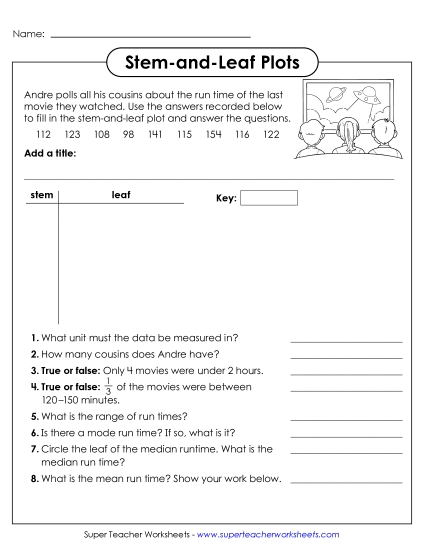
The free stem and leaf plot worksheet asks kids to order a data set and fill in a plot, including adding a title and key. Then they'll specify the unit of measurement, range, modes, and frequency of data points above a given value.
5th and 6th Grades
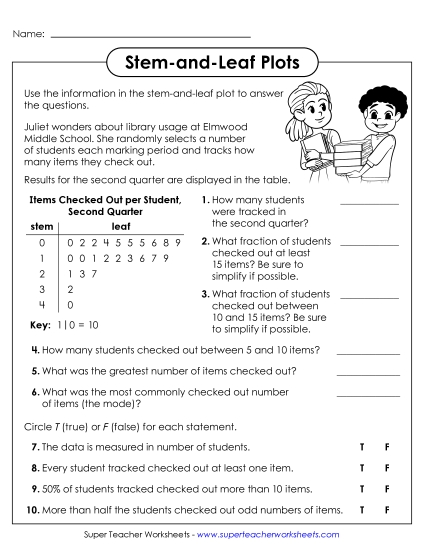
Read the plot about numbers of checked out library materials, then answer 10 questions. Examples include what fraction of students checked out a certain range of items, or what percent of students checked out more than a certain number of items.
5th and 6th Grades
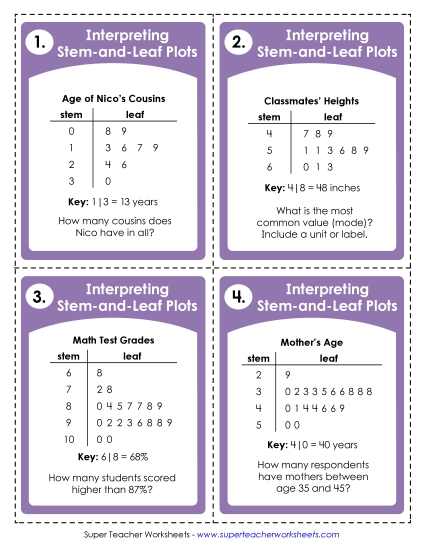
Practice interpreting stem and leaf plots with this taskcard set. Questions ask about total number of values plotted, identifying the most common value (mode), and finding the number of values greater than or equal to a given value or range. Perfect for individual or groupwork.
5th and 6th Grades

Accurately read two stem and leaf plots and use the data to calculate mean, median, mode, and range.
6th Grade
Use the raw data to create a stem and leaf plot, including a title and key. Then answer 8 questions about the number of data points, dividing the data into fractions, and calculating measures of center and variability.
6th Grade
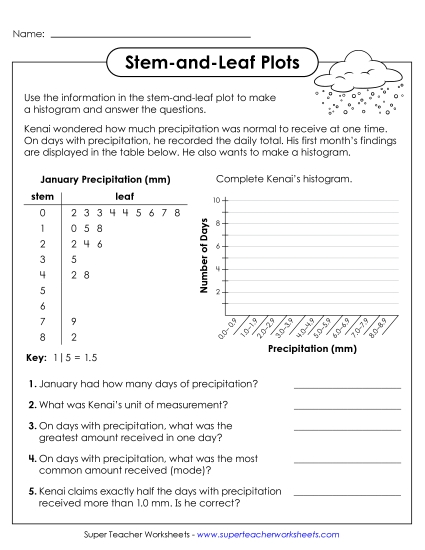
Correctly interpret the stem and leaf plot data to complete a histogram. Then answer questions about the data, including identifying the mode and total number of data points.
6th Grade

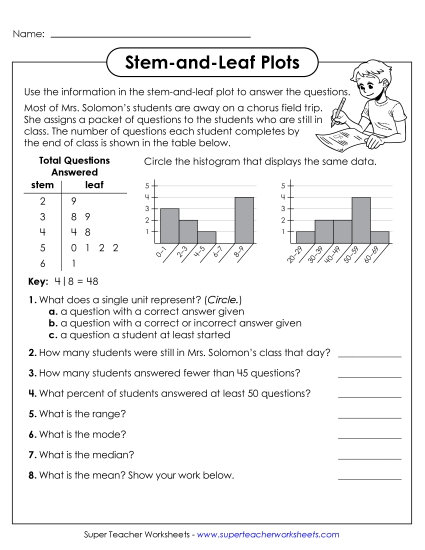
Identify which histogram displays the same data presented in a stem and leaf plot. Find range, mode, median, and mean, explain what a single unit represents in context, and more on this practice sheet!
6th Grade
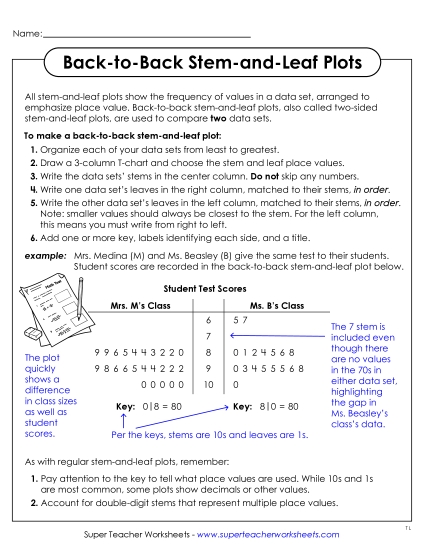
This free stem-and-leaf plot anchor chart handout means making a two-sided stem-and-leaf plot will be a breeze! Follow the steps to make your own plot that compares two data sets, or use the labeled to model to learn how to interpret a back-to-back plot.
6th and 7th Grades
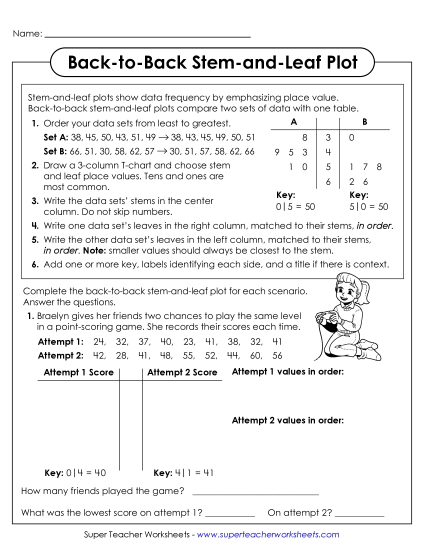
Follow the directions explaining how to make back to back stem and leaf plots to make two plots of your own. Afterwards, practice answering questions that compare the data sets.
6th and 7th Grades
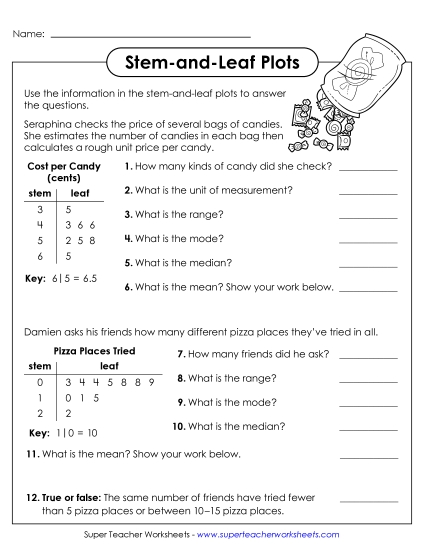
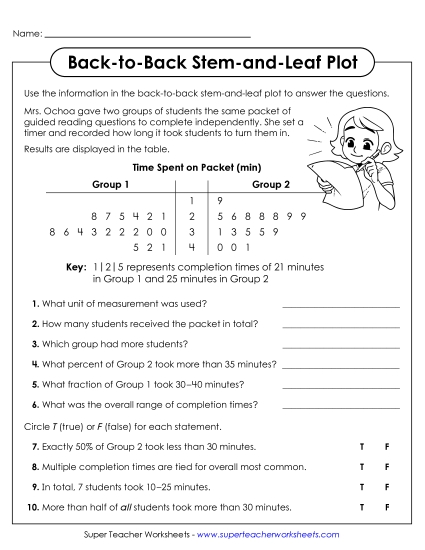
Answer ten questions using the data in the plot. Specify the unit of measurement used in data collection, the size of the data sets, data range, and more.
6th and 7th Grades
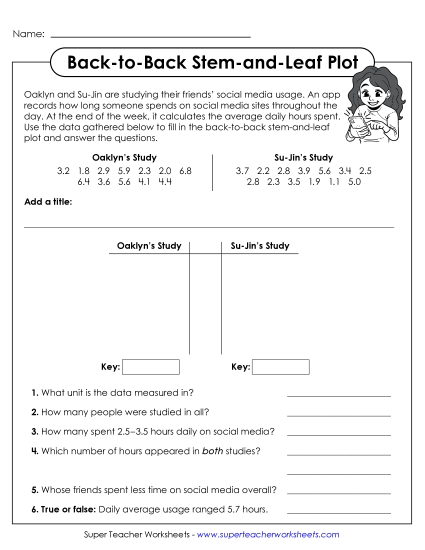
Fill in the stem and leaf plot practice template using the raw data provided -- and don't forget to give it an accurate title and key! Then answer the paired questions.
6th and 7th Grades
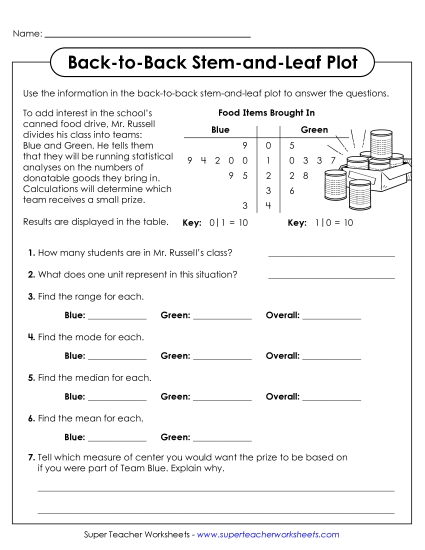
Use the information in the back-to-back plot to answer the questions. Calculate measures of center and variability for both data sets and compare them to one another as well as to the combined data set.
6th and 7th Grades
Click here to browse our full collection of worksheets on graphing or displaying data.
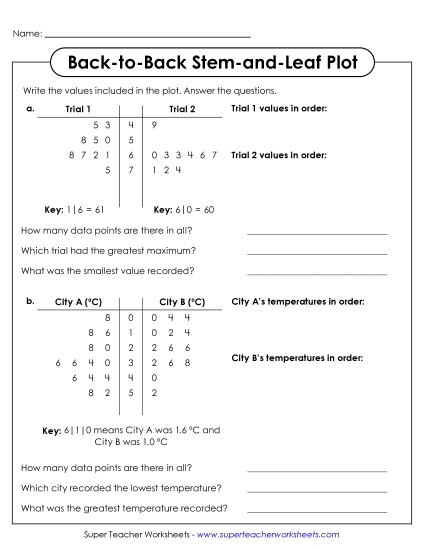
Read the data values displayed in two two-sided stem and leaf plots. Then organize sets of raw data into two original plots (space is given for ordering data first). Then answer basic questions about each plot.
6th and 7th Grades