Stem-and-Leaf Plot (Stats & Histogram) Printable Stem And Leaf Plots Mean Median Mode Range PDF Worksheet
Stem-and-Leaf Plot (Stats & Histogram)
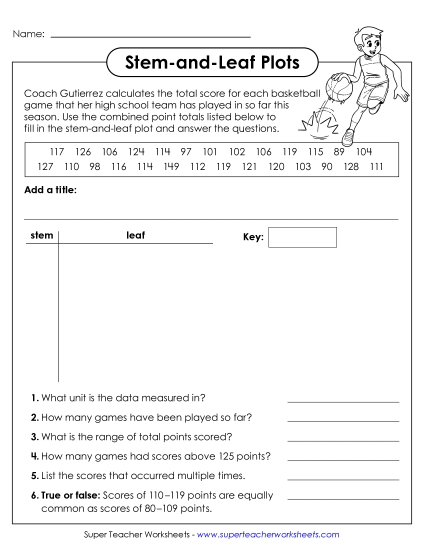
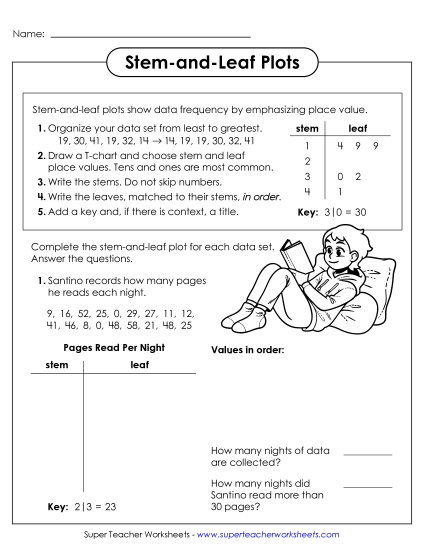
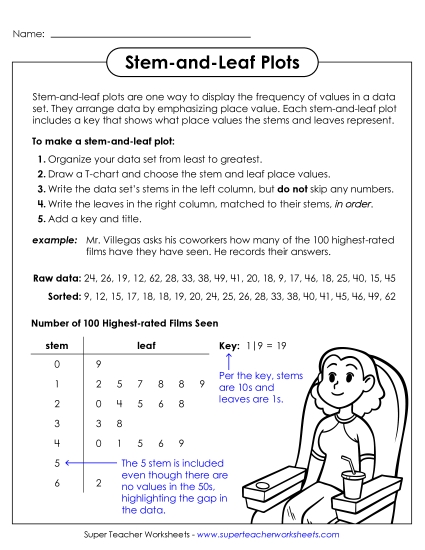
Explore the fascinating world of data with our Grade 6 printable PDF worksheet titled "Stem-and-Leaf Plot (Stats & Histogram)." This resource is perfect for classroom learning or homework, helping students master skills in interpreting histograms and stem-and-leaf plots. They'll engage with questions to find range, mode, median, and mean, and delve into what each unit represents. Ideal for teaching key concepts in elementary statistics, this activity ensures fun and effective practice and review.
This worksheet is recommended for students in Sixth Grade.
- Common Core Standards
6.SP.46.SP.5a6.SP.5b6.SP.5c
 Back
Back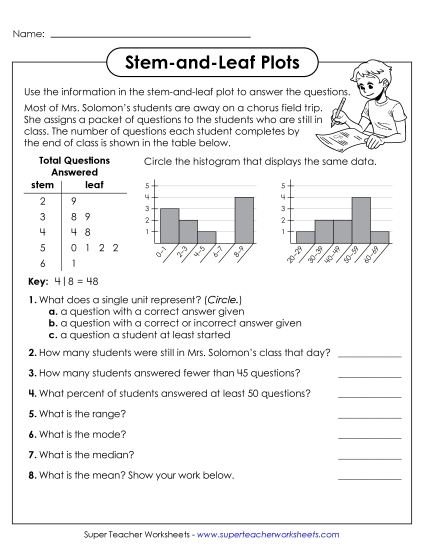
You May Also Be Interested In