Bar Graphs vs. Histograms Printable Graphing Graph Vs Histrogram Anchor Chart PDF Worksheet
Bar Graphs vs. Histograms
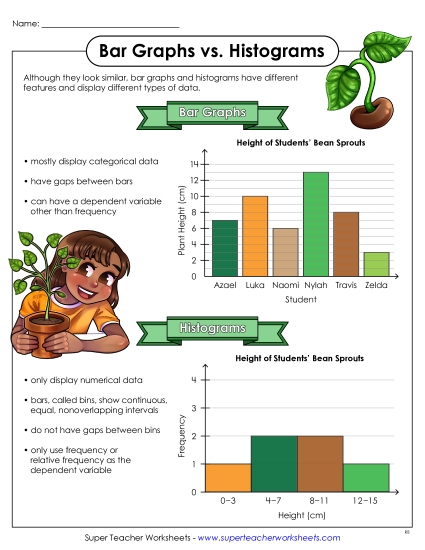
Unlock the secrets of data representation with our "Bar Graphs vs. Histograms" printable PDF worksheet, ideal for grade levels 5 to 7. This engaging resource provides a clear comparison through vibrant anchor charts and illustrative examples. Perfect for classroom instruction, homework review, or as a fun activity to enhance learning skills in elementary students. Teach, review, and reinforce these crucial concepts effectively with this essential teaching tool.
This worksheet is recommended for students in Fifth Grade, Sixth Grade and Seventh Grade.
- Common Core Standards
6.SP.4


You May Also Be Interested In


