Mean Absolute Deviation (Line Plots) Printable Statistics PDF Worksheet
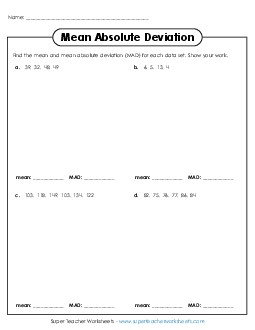
Mean Absolute Deviation (Line Plots)
Unlock the power of data analysis with our "Mean Absolute Deviation (Line Plots)" worksheet, ideal for 6th and 7th-grade students. This engaging printable PDF resource offers elementary students the chance to practice and learn how to calculate mean and Mean Absolute Deviation (MAD) through real-world problems. Perfect for classroom instruction, homework, or review, it encourages critical thinking and application of statistical concepts. Equip your students with the skills they need to tackle questions and find answers effectively, making learning both fun and productive.
This worksheet is recommended for students in Sixth Grade and Seventh Grade.
Common Core Standards:
6.SP.3, 6.SP.5c, 7.SP.3.
")

You May Also Be Interested In