Describing Data Distributions: Line Plots & Histograms Printable Statistics PDF Worksheet
Describing Data Distributions: Line Plots & Histograms
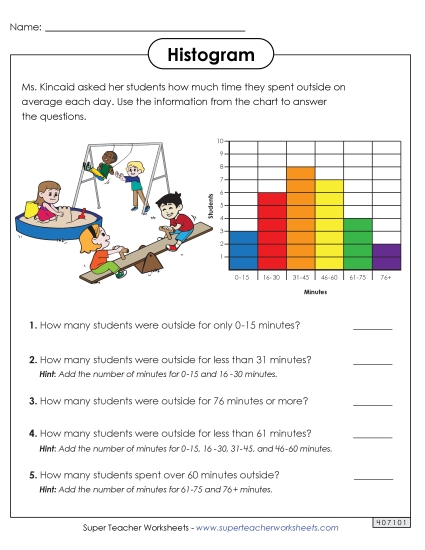
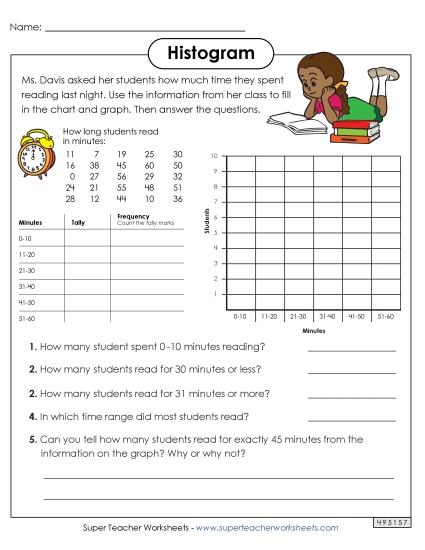
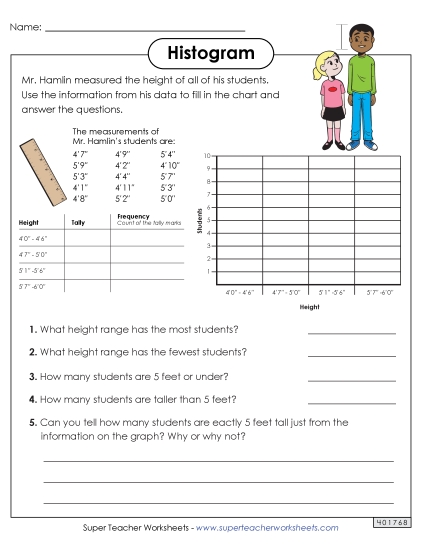
Explore key concepts in statistics with our printable PDF worksheet titled "Describing Data Distributions: Line Plots & Histograms," ideal for 6th and 7th graders. This resource offers engaging activities to help students learn and practice how to interpret and describe data using line plots and histograms. Perfect for classroom instruction, homework, or as a review, it enhances teaching methods by providing clear problems, questions, and answers to develop essential skills in data analysis.
This worksheet is recommended for students in Sixth Grade and Seventh Grade.
Common Core Standards:
6.SP.2, 6.SP.5c.


You May Also Be Interested In