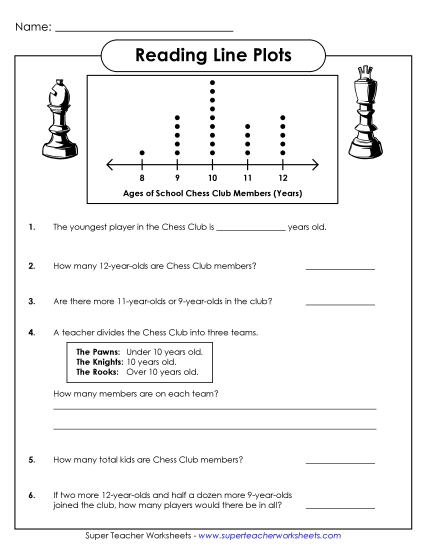
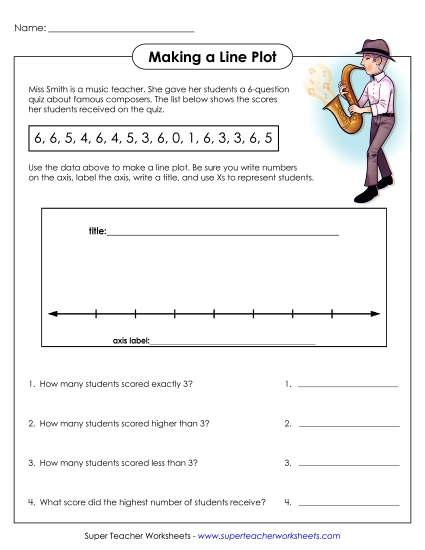
Describing Data Distributions: Line Plots & Histograms Printable Statistics PDF Worksheet
Describing Data Distributions: Line Plots & Histograms
Enhance your 6th and 7th graders' understanding of data distributions with our engaging and educational PDF worksheet titled "Describing Data Distributions: Line Plots & Histograms." This resource offers a fun way to practice and review key skills in analyzing line plots and histograms. Ideal for classroom instruction, homework, or as a study tool, this printable helps students learn to tackle problems, answer questions, and excel in elementary statistics. Perfect for both teachers and homeschoolers looking to boost learning outcomes.
This worksheet is recommended for students in Sixth Grade and Seventh Grade.
Common Core Standards:
6.SP.2, 6.SP.5c.


You May Also Be Interested In