Describing Data Distributions: Histograms Printable Graphing PDF Worksheet
Describing Data Distributions: Histograms
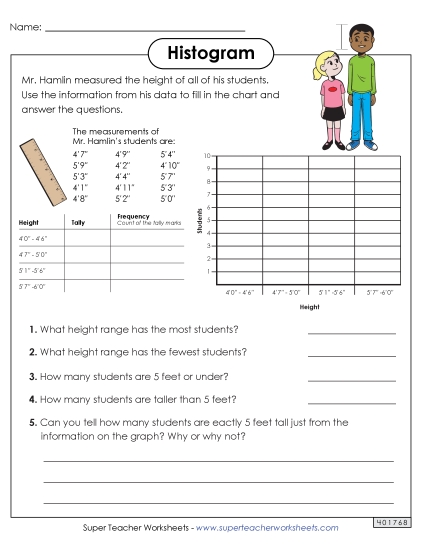
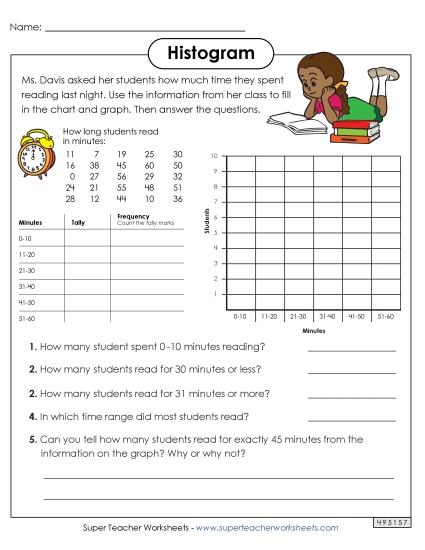
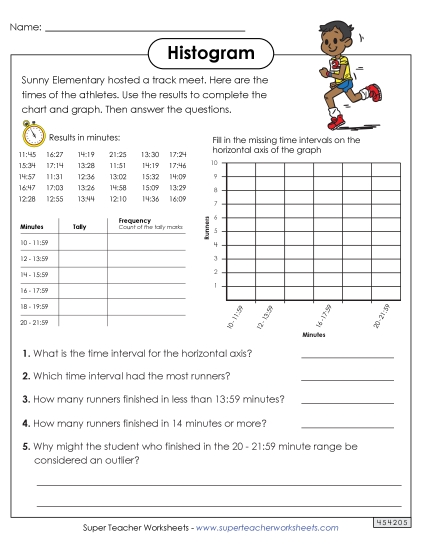
Enhance your students' understanding of histograms with our "Describing Data Distributions: Histograms" worksheet. Perfect for 6th to 7th-grade classrooms, this PDF resource offers engaging activities to teach key concepts such as symmetry, skews, gaps, clusters, and outlier bins. The second page brings practical learning with context-based histogram problems, making it an ideal tool for homework, review, or classroom instruction. Fun, educational, and designed to boost students' skills in data interpretation, it's a must-have for effective teaching.
This worksheet is recommended for students in Sixth Grade and Seventh Grade.
- Common Core Standards
6.SP.26.SP.5a6.SP.5c
 Back
Back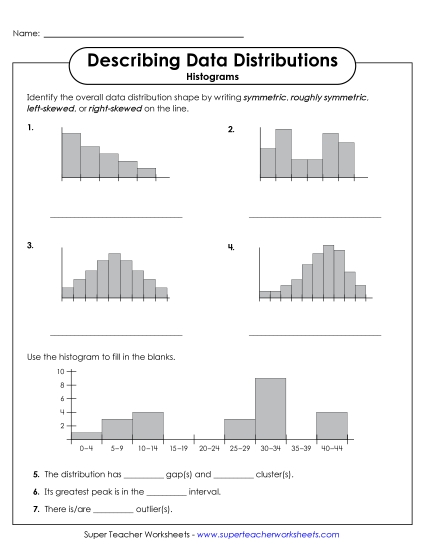
You May Also Be Interested In