Pie Graph: Favorite Seasons Printable Graphing Graph Hard 1 PDF Worksheet
Pie Graph: Favorite Seasons
Engage your students in grades 3 to 5 with our "Seasons Pie Graph" printable PDF worksheet. Ideal for classroom review or homework, this resource helps teach data interpretation through fun, real-world problems. Students will learn to analyze a pie graph displaying favorite seasons and practice their skills by answering related questions. This activity enhances learning by reinforcing instruction on percentages, making it a perfect tool for elementary-level study.
This worksheet is recommended for students in Third Grade, Fourth Grade, and Fifth Grade.
- Common Core Standards
4.NF.16.RP.3c
 Back
Back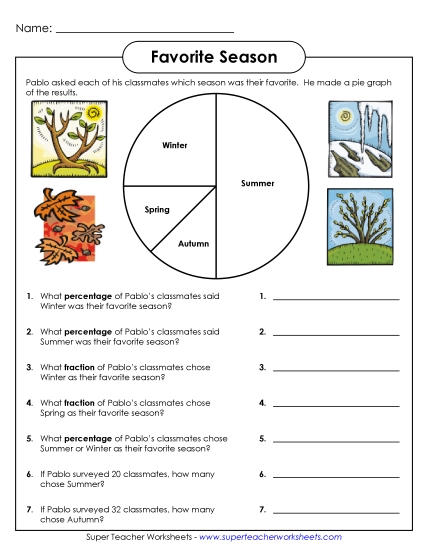
You May Also Be Interested In